Fig. 10
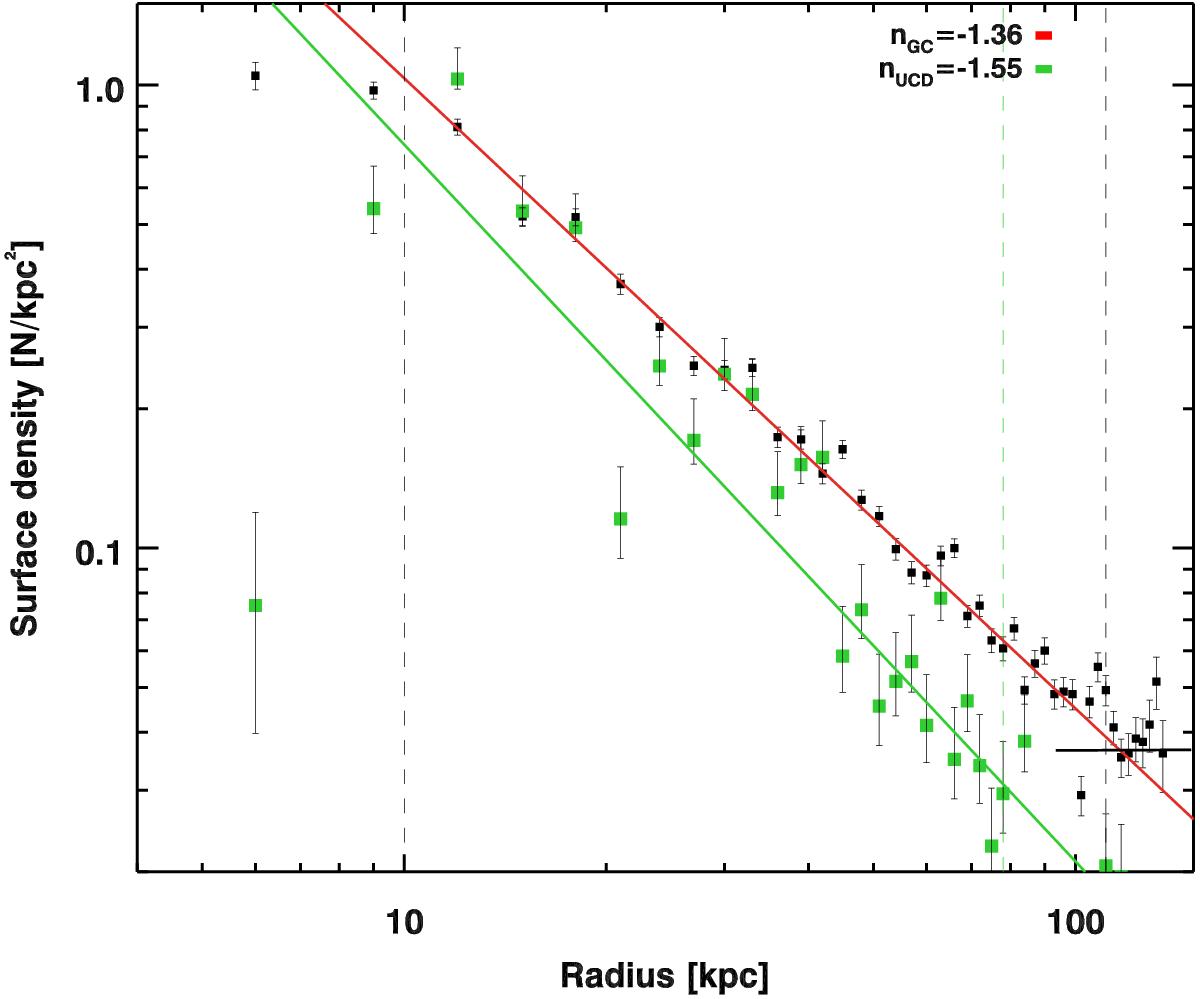
Projected surface density distribution of all selected globular clusters as a function of their galactocentric distance to NGC 1399. The red line shows the best power-law fit with an exponent of n = −1.36. The background level was labeled with a black horizontal line. The vertical dashed black lines show the radial interval to which we restricted our fit. The radial distribution of the confirmed UCDs is shown in green. As their absolute radial density is an order of magnitude smaller than the GCs, their density is scaled up by a factor of 10 for better visibility in the plot.
Current usage metrics show cumulative count of Article Views (full-text article views including HTML views, PDF and ePub downloads, according to the available data) and Abstracts Views on Vision4Press platform.
Data correspond to usage on the plateform after 2015. The current usage metrics is available 48-96 hours after online publication and is updated daily on week days.
Initial download of the metrics may take a while.