Fig. B.4
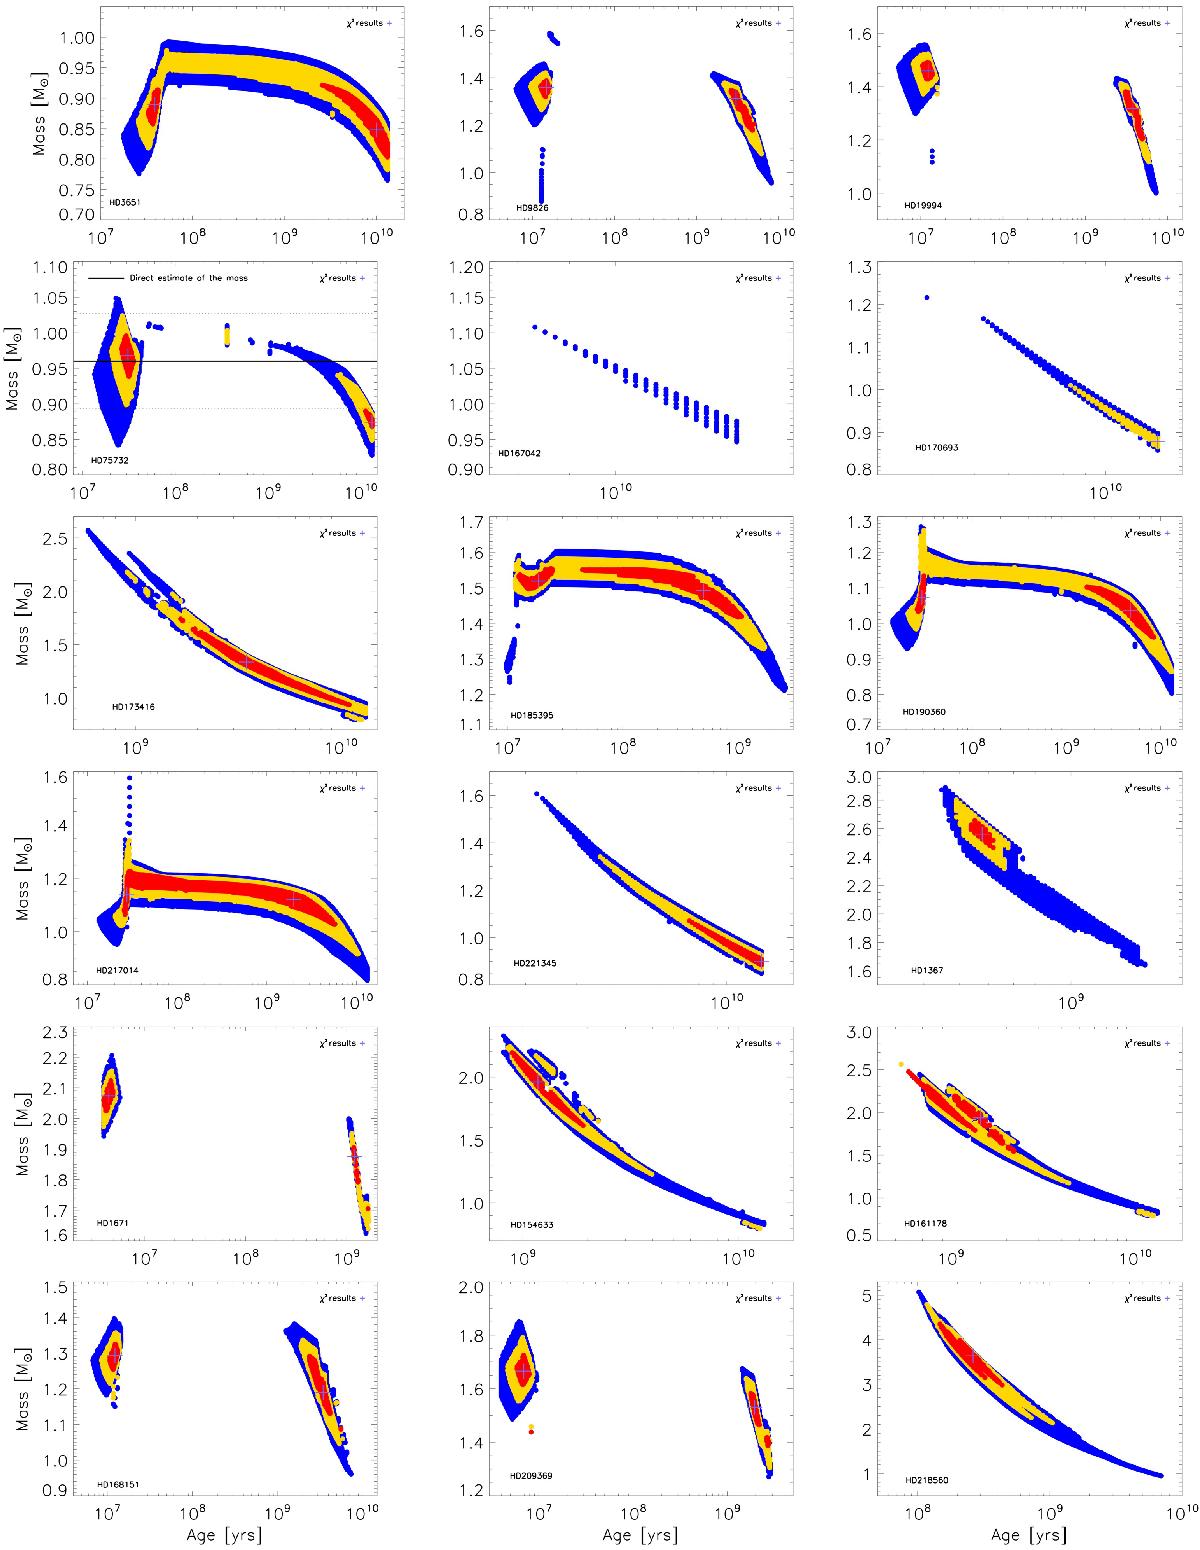
Approximate contour maps of the likelihood ℒ as a function of the stellar masses and ages. Values within 1, 2, and 3 of each term of Eq. (11) appear in red, yellow, and blue, respectively. Considering a flat prior (which is reasonable), these maps show the joint PDF of M⋆ and the age. The best fit old and young (if any) solutions are represented by crosses. The solid horizontal line in the case of HD 75732 corresponds to an independent estimate of the mass, and the dashed horizontal lines correspond to the errobars on M⋆ (see Sect. 4.3).
Current usage metrics show cumulative count of Article Views (full-text article views including HTML views, PDF and ePub downloads, according to the available data) and Abstracts Views on Vision4Press platform.
Data correspond to usage on the plateform after 2015. The current usage metrics is available 48-96 hours after online publication and is updated daily on week days.
Initial download of the metrics may take a while.