Fig. B.3
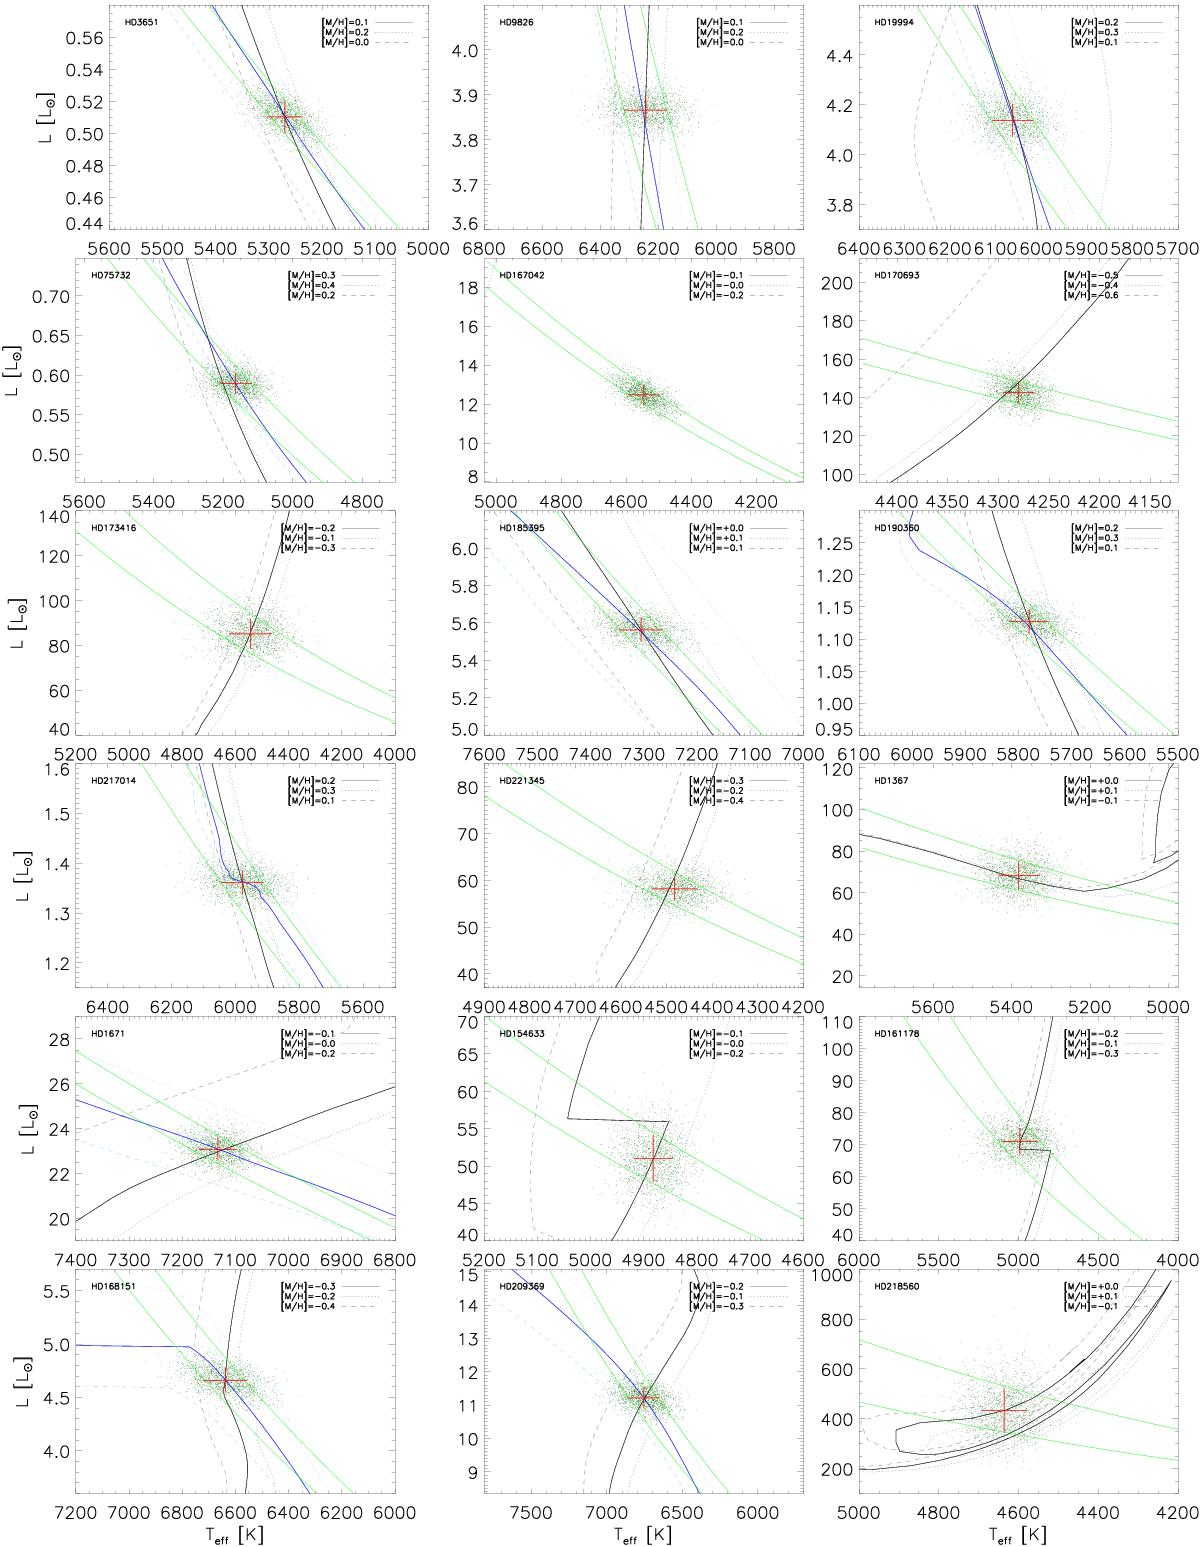
Isochrones from PARSEC models. The clouds of points represent the MC distribution. The black lines are for old solutions and the blue lines for young solutions. The isochrones of the stellar age at metallicity of ±0.1 dex are plotted in lighter colors than the reference (dotted and dashed lines). The solid light green lines represent the contraints of the radius at 1σ (see Sect. 4).
Current usage metrics show cumulative count of Article Views (full-text article views including HTML views, PDF and ePub downloads, according to the available data) and Abstracts Views on Vision4Press platform.
Data correspond to usage on the plateform after 2015. The current usage metrics is available 48-96 hours after online publication and is updated daily on week days.
Initial download of the metrics may take a while.