Free Access
Fig. 7
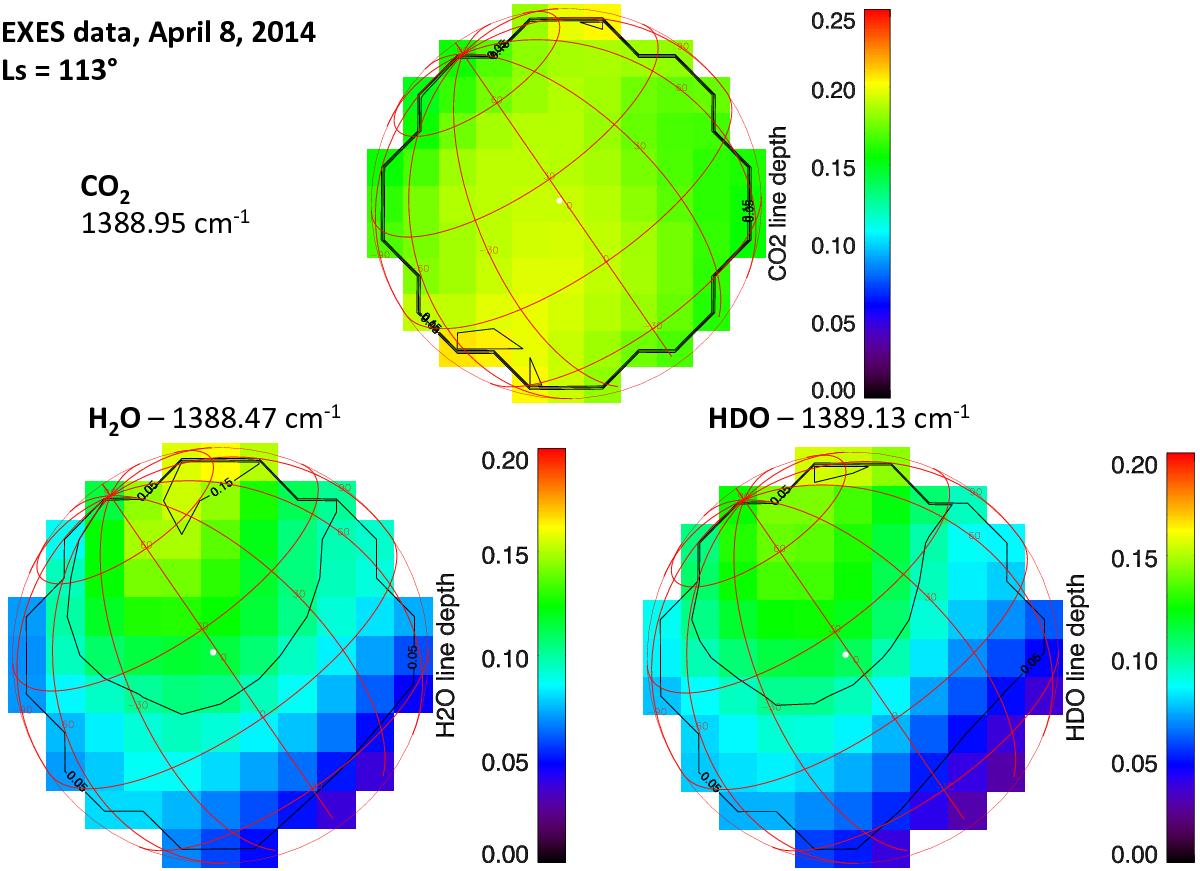
Maps of the line depths for CO2 at 1388.95 cm-1 (top), H2O at 1388.47 cm-1 (lower left), and HDO at 1389.13 cm-1 (lower right), recorded with EXES (Ls = 113°). The subsolar point is indicated by a white dot.
Current usage metrics show cumulative count of Article Views (full-text article views including HTML views, PDF and ePub downloads, according to the available data) and Abstracts Views on Vision4Press platform.
Data correspond to usage on the plateform after 2015. The current usage metrics is available 48-96 hours after online publication and is updated daily on week days.
Initial download of the metrics may take a while.