Fig. 16
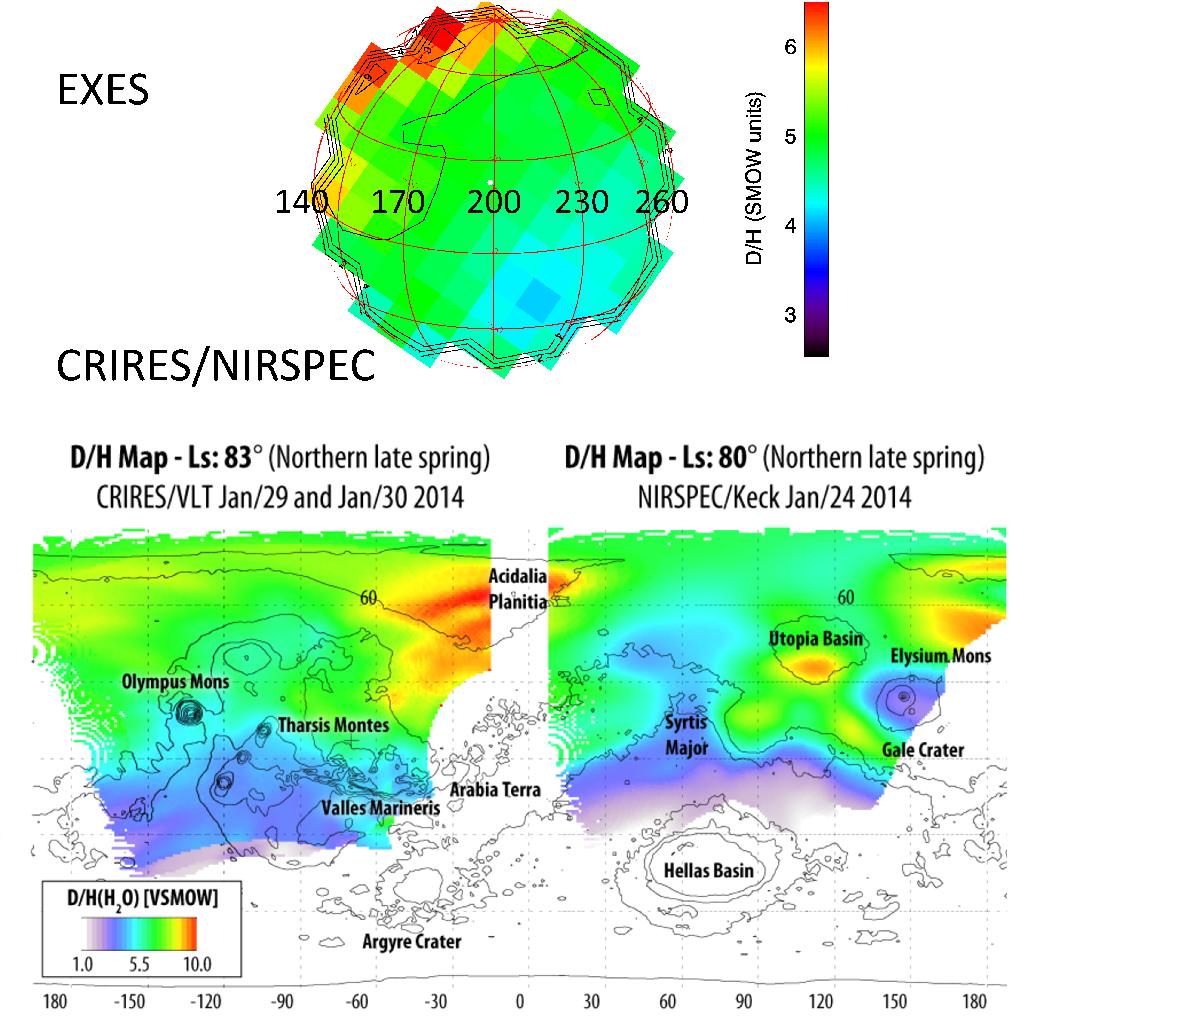
Top: map of the D/H ratio in VSMOW units retrieved from the EXES data recorded on April 8, 2014 (Ls = 113°, same as Fig. 13, bottom). Bottom: map of the D/H mixing ratio (in VSMOW units) retrieved by Villanueva et al. (2015) in January 2014 for Ls = 80 deg and 83 deg. The left map of Villanueva et al. (2015) matches the longitude range covered by the EXES observations.
Current usage metrics show cumulative count of Article Views (full-text article views including HTML views, PDF and ePub downloads, according to the available data) and Abstracts Views on Vision4Press platform.
Data correspond to usage on the plateform after 2015. The current usage metrics is available 48-96 hours after online publication and is updated daily on week days.
Initial download of the metrics may take a while.