Fig. 13
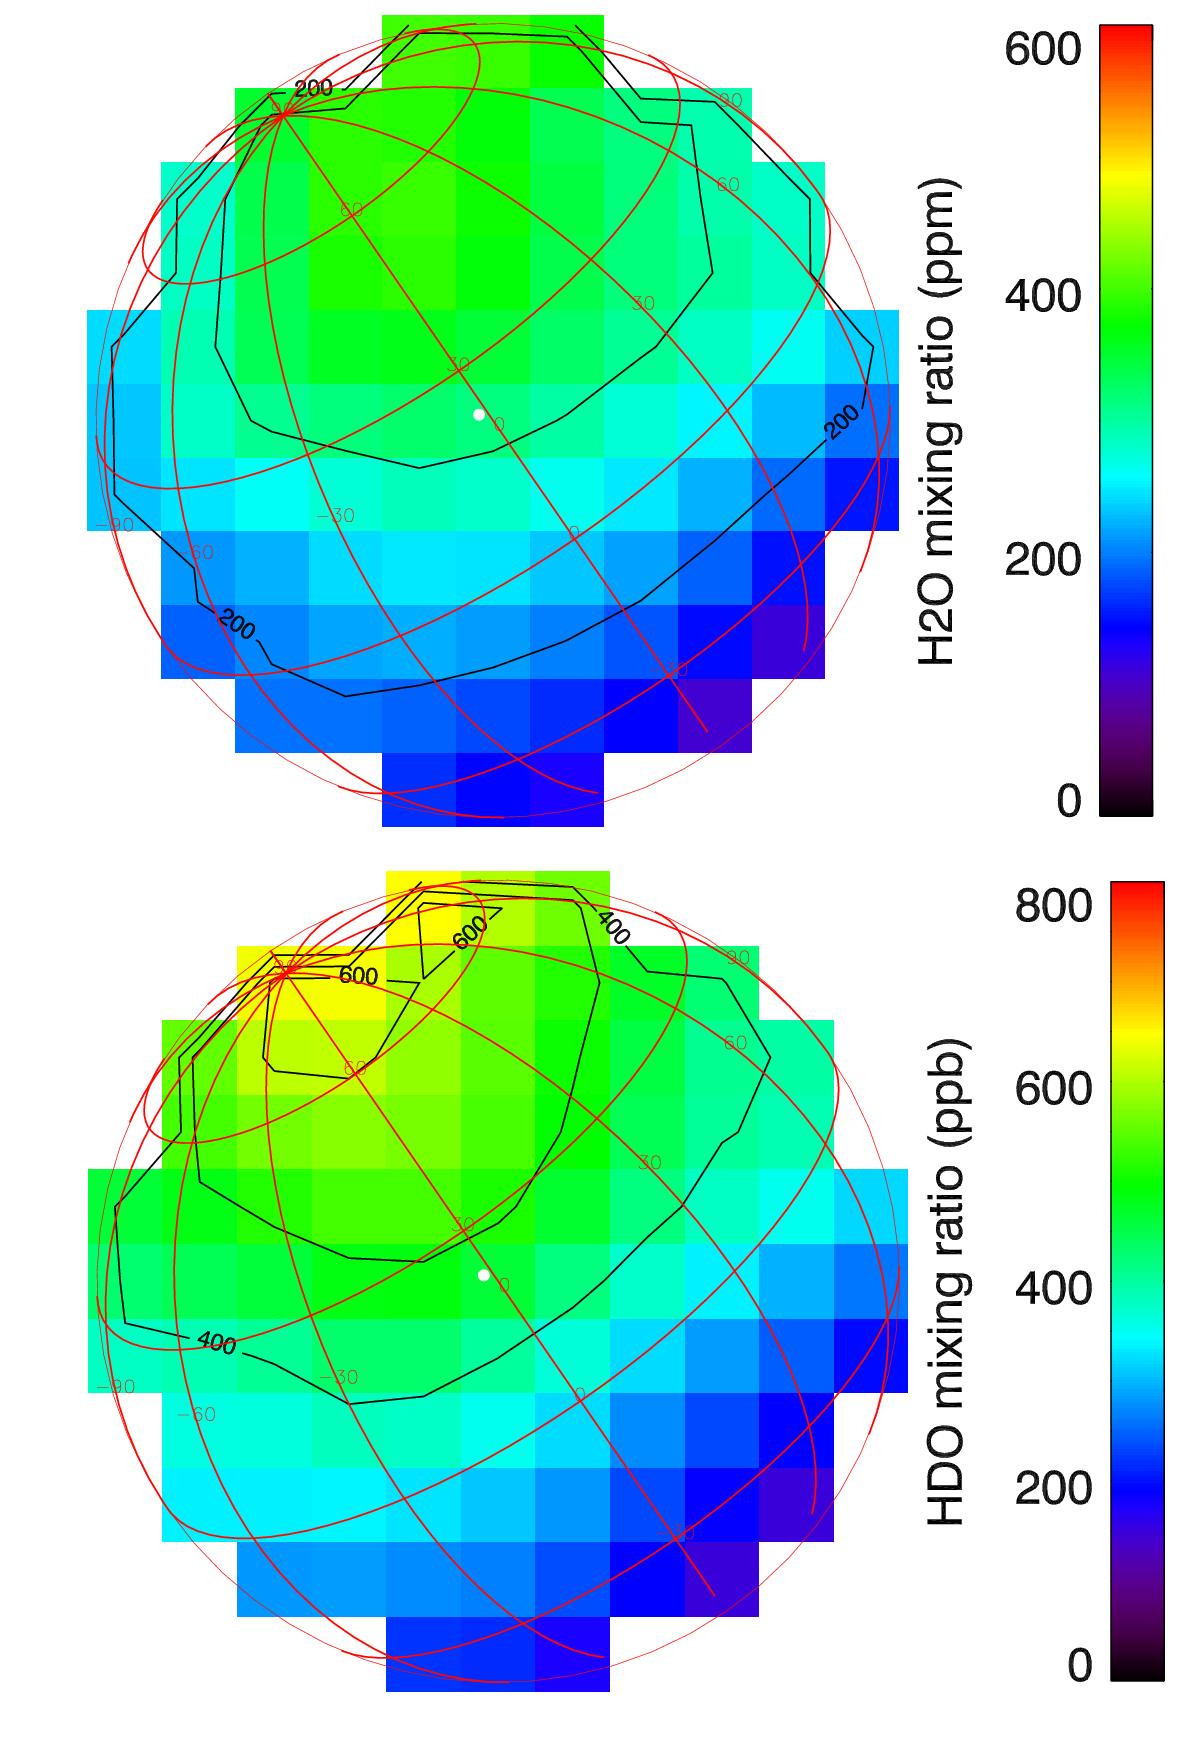
Top: map of the H2O volume mixing ratio (in ppmv) retrieved from the EXES data recorded on April 8, 2014 (Ls = 113°), converted from the H2O/CO2 line depth ratio (see text). Bottom: map of the HDO volume mixing ratio (in ppbv) retrieved from the same data, converted from the HDO/CO2 line depth ratio. The subsolar point is indicated by a white dot.
Current usage metrics show cumulative count of Article Views (full-text article views including HTML views, PDF and ePub downloads, according to the available data) and Abstracts Views on Vision4Press platform.
Data correspond to usage on the plateform after 2015. The current usage metrics is available 48-96 hours after online publication and is updated daily on week days.
Initial download of the metrics may take a while.