Free Access
Fig. 6
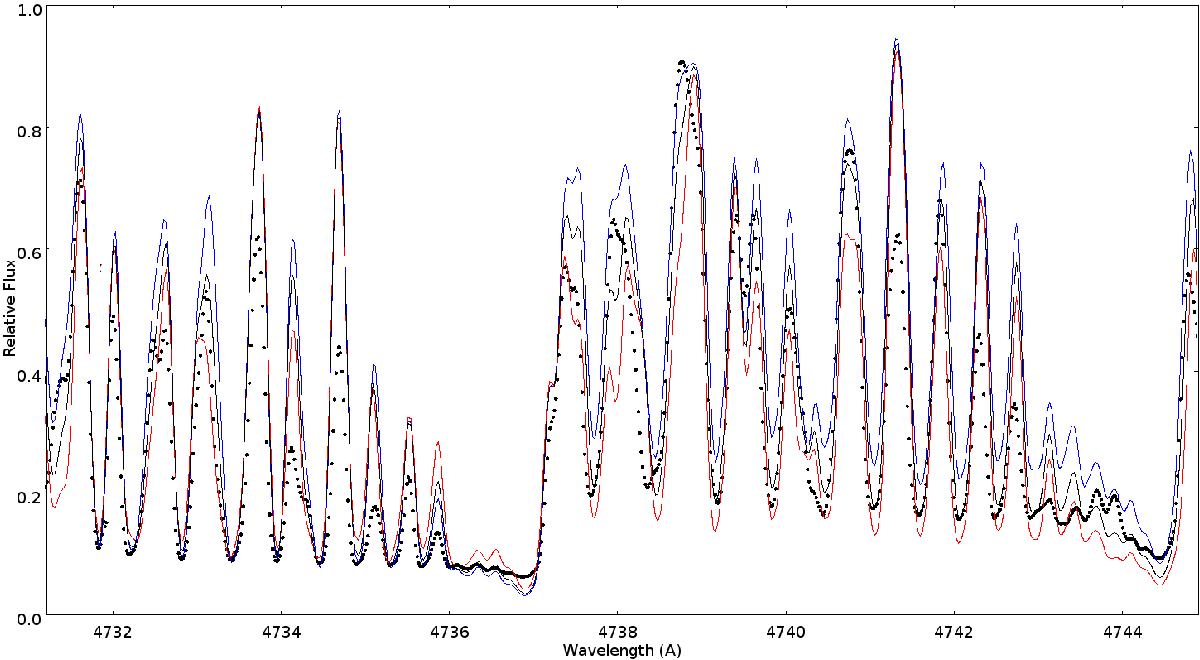
12C13C and 13C13C band heads around 474.0 nm (with log ϵ(C) = 8.2 and log ϵ(N) = 7.9) for 12C/13C = 2 (red curve), 4 (black curve), and 7 (blue curve). Except otherwise stated, the atmospheric parameters used to generate the synthetic spectra are those listed in Table 4.
Current usage metrics show cumulative count of Article Views (full-text article views including HTML views, PDF and ePub downloads, according to the available data) and Abstracts Views on Vision4Press platform.
Data correspond to usage on the plateform after 2015. The current usage metrics is available 48-96 hours after online publication and is updated daily on week days.
Initial download of the metrics may take a while.