Fig. 3
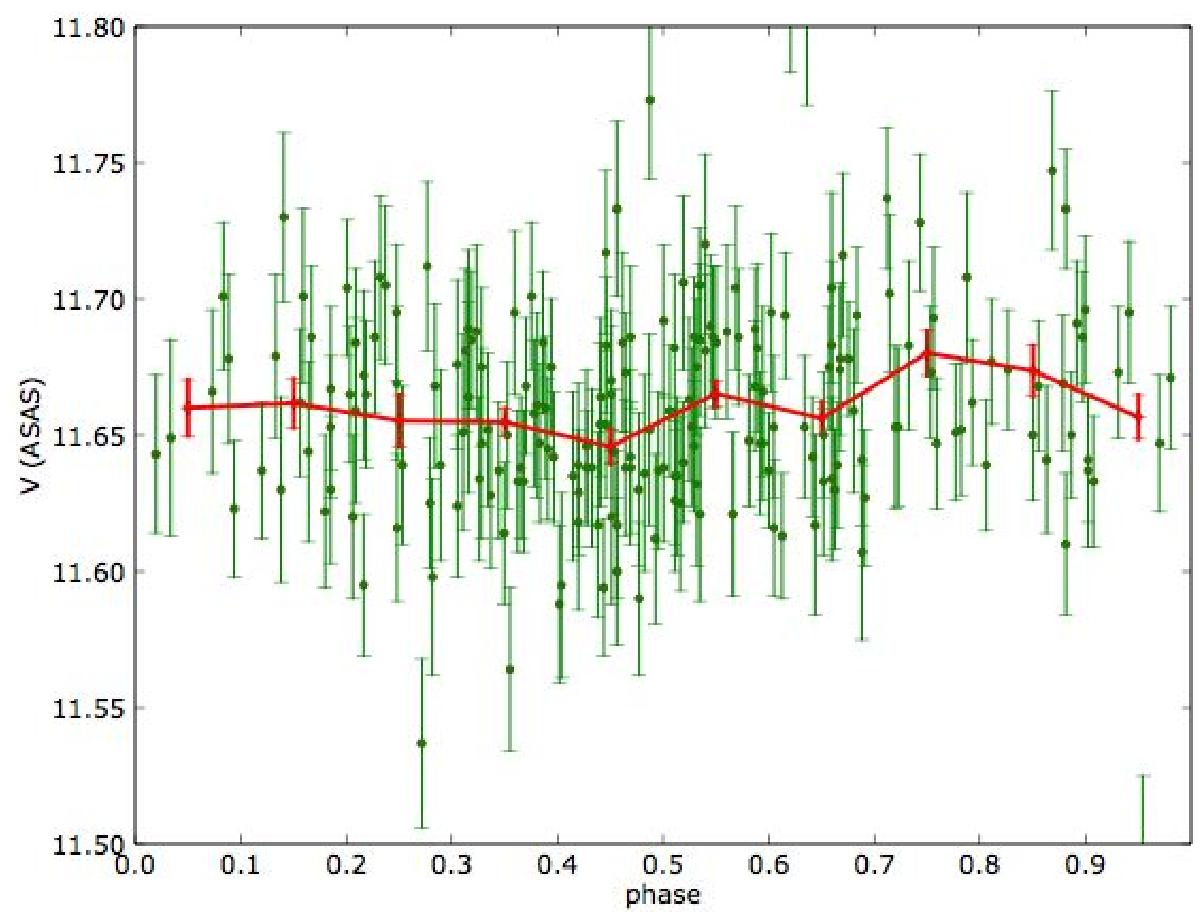
Photometric data (grade A only) from the ASAS-3 catalogue for HE 0017+0055 = ASAS 002022+0112.1, folded on the 383 d period inferred from the radial-velocity variations. The span of the ordinate axis has been set to eliminate outlying data points. The red curve with error bars corresponds to the average values of the V magnitude in bins of width 0.1 in phase, after eliminating outlying points (i.e. those outside the graphical window). The error bars along that curve correspond to the error on the mean, i.e. the standard dispersion in the considered bin divided by ![]() , where N is the number of data points in the bin.
, where N is the number of data points in the bin.
Current usage metrics show cumulative count of Article Views (full-text article views including HTML views, PDF and ePub downloads, according to the available data) and Abstracts Views on Vision4Press platform.
Data correspond to usage on the plateform after 2015. The current usage metrics is available 48-96 hours after online publication and is updated daily on week days.
Initial download of the metrics may take a while.