Free Access
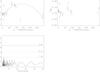
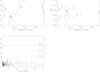
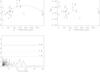
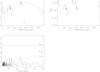
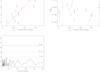
Fig. B.1
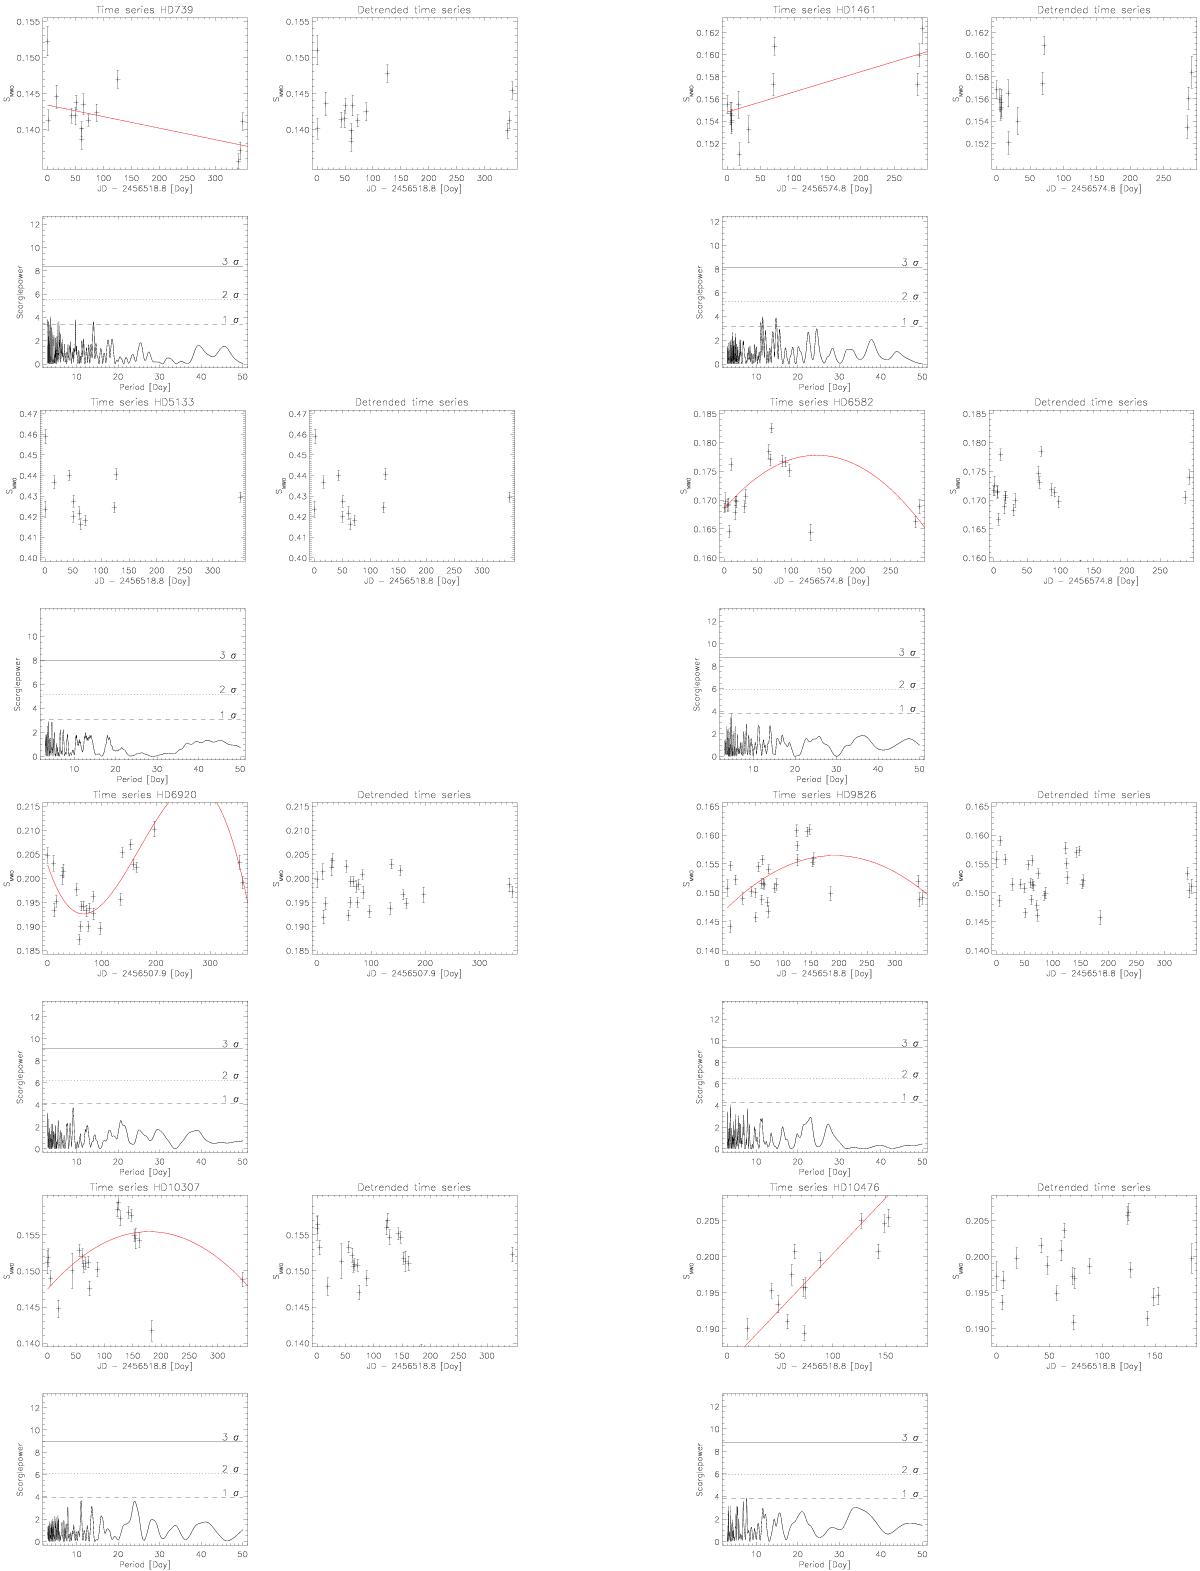
Plots of individual stars. Each figure contains the original time series (top left) with HD number, including a polynomial fit (full line) to eliminate a long-term trend, the time series corrected for a long-term trend (top right), the Scargle periodogram (bottom left) and a phase plot (bottom right).
This figure is made of several images, please see below:
Current usage metrics show cumulative count of Article Views (full-text article views including HTML views, PDF and ePub downloads, according to the available data) and Abstracts Views on Vision4Press platform.
Data correspond to usage on the plateform after 2015. The current usage metrics is available 48-96 hours after online publication and is updated daily on week days.
Initial download of the metrics may take a while.