Free Access
Fig. 8
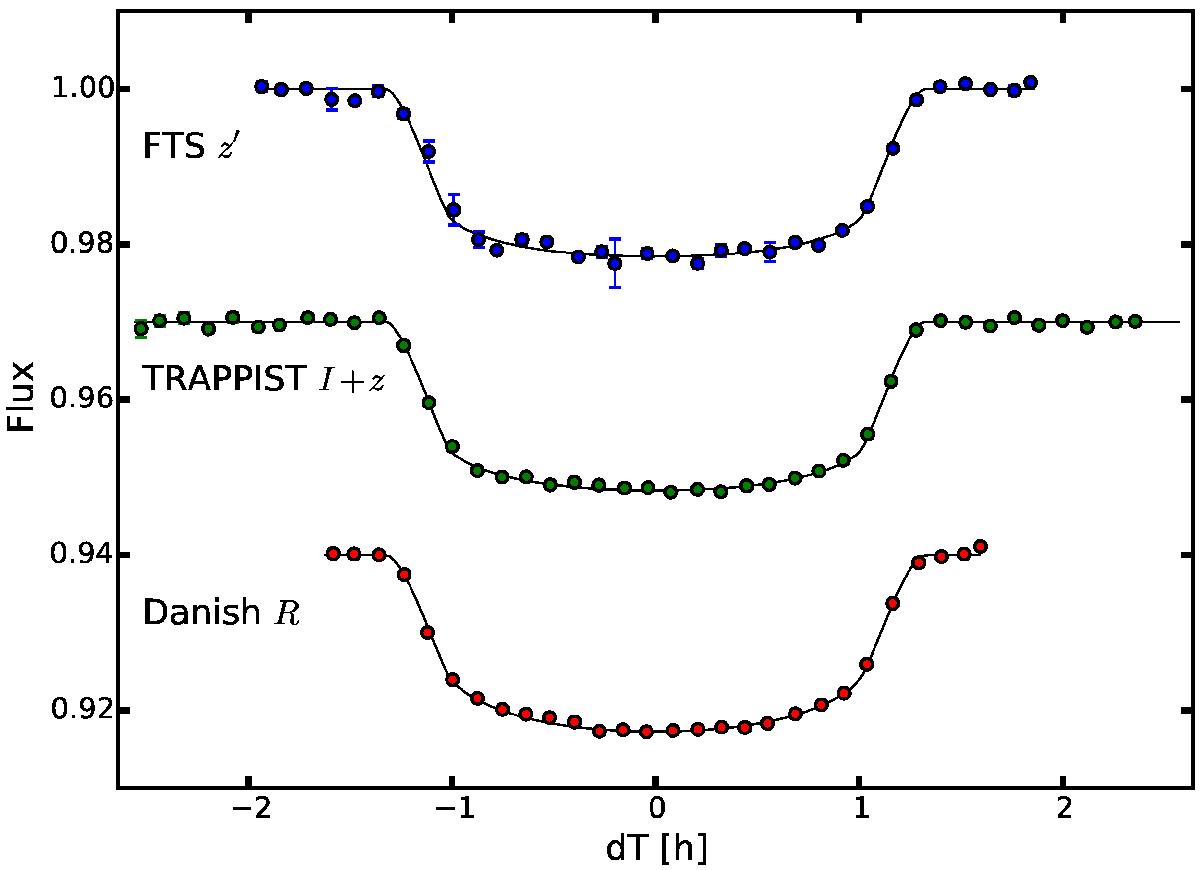
WASP-41b transit data (blue: FTS z′; green: TRAPPIST I + z; red: Danish R) and best fit model (black line). The TRAPPIST light curve was obtained by binning the data from five transit observations, and the Danish one from one full and one partial transit observations. Each point corresponds to a 7.2 min bin.
Current usage metrics show cumulative count of Article Views (full-text article views including HTML views, PDF and ePub downloads, according to the available data) and Abstracts Views on Vision4Press platform.
Data correspond to usage on the plateform after 2015. The current usage metrics is available 48-96 hours after online publication and is updated daily on week days.
Initial download of the metrics may take a while.