Fig. 3
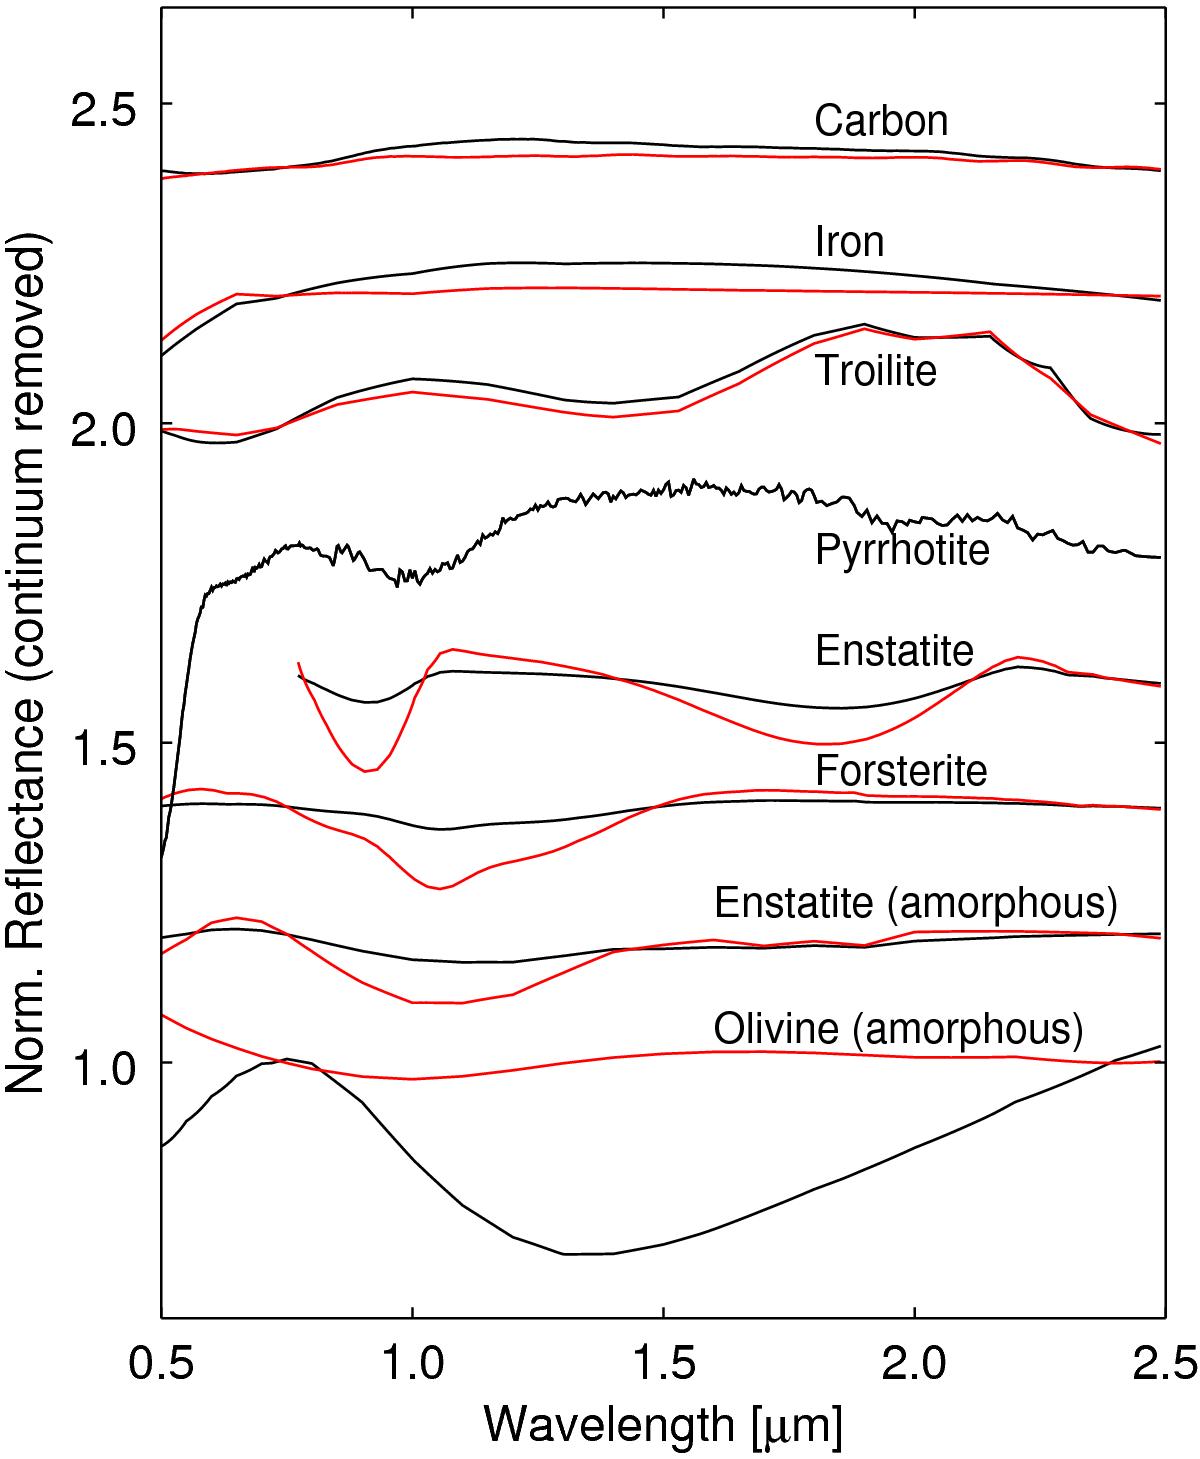
Reflectance spectra of the minerals used in the modelling procedure as calculated from the Mie-Hapke radiative transfer code. Spectra are normalised to unity at 0.75 μm and offset by 0.2 unity with respect to one another for visibility. To highlight the spectral features of each specie and their relative intensities, we removed the continuum by dividing each spectrum by a line that fits the spectrum at 0.75 μm and 2.40 μm. The red curves correspond to a distribution of grains with large sizes compared to the wavelength (20−30 μm), whereas the black curves correspond to a distribution of grains smaller than or similar to the wavelength (0.1−2.0 μm). Since no optical constants were available for pyrrhotite, we used a reflectance spectrum from the USGS database for this mineral. See Sect. 4.2 for a discussion of the reflectance spectrum of amorphous olivine.
Current usage metrics show cumulative count of Article Views (full-text article views including HTML views, PDF and ePub downloads, according to the available data) and Abstracts Views on Vision4Press platform.
Data correspond to usage on the plateform after 2015. The current usage metrics is available 48-96 hours after online publication and is updated daily on week days.
Initial download of the metrics may take a while.