Fig. 2
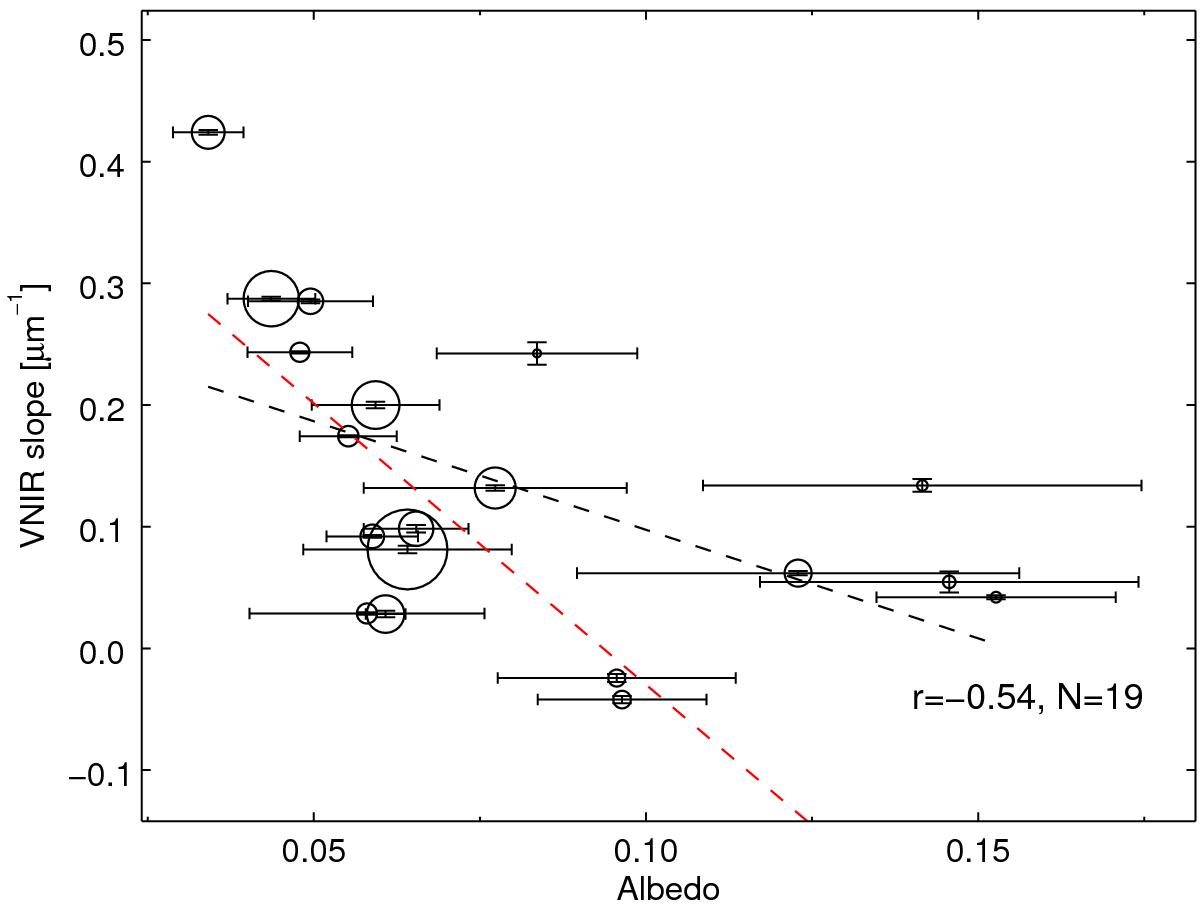
VNIR spectral slopes versus albedos for 19 Themis family members. The size of the circles is proportional to the diameter of the objects. The black and red dotted lines correspond to a linear regression of the data points, unweighted (black line) and weighted by the uncertainty on the measurements (red line). A strong anti-correlation suggests that a single mechanism is responsible for bluer spectra and higher albedos. Data from Ziffer et al. (2011) and de León et al. (2012) and the present work were used to produce this figure.
Current usage metrics show cumulative count of Article Views (full-text article views including HTML views, PDF and ePub downloads, according to the available data) and Abstracts Views on Vision4Press platform.
Data correspond to usage on the plateform after 2015. The current usage metrics is available 48-96 hours after online publication and is updated daily on week days.
Initial download of the metrics may take a while.