Fig. 2
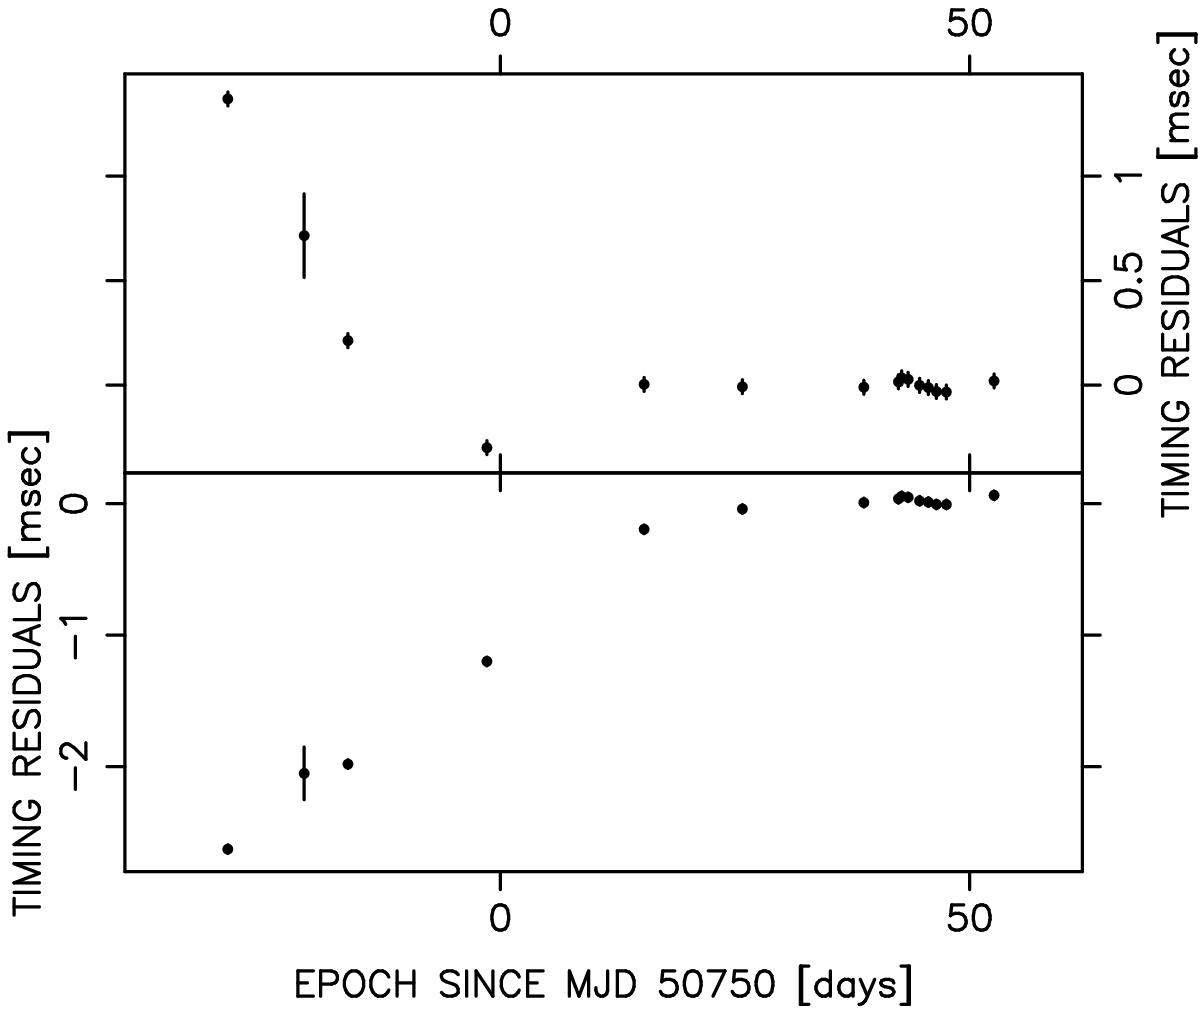
Top panel: result of using TEMPO2 on the X-ray data with the parameters of model 1 in Table 1 as constant input (i.e., without any fitting). The plot is restricted to the post-event and pre-glitch duration, along with four data points before this duration, to better view the event itself. Bottom panel: same as top panel, but using the parameters of model 2 in 1.
Current usage metrics show cumulative count of Article Views (full-text article views including HTML views, PDF and ePub downloads, according to the available data) and Abstracts Views on Vision4Press platform.
Data correspond to usage on the plateform after 2015. The current usage metrics is available 48-96 hours after online publication and is updated daily on week days.
Initial download of the metrics may take a while.