Fig. 6
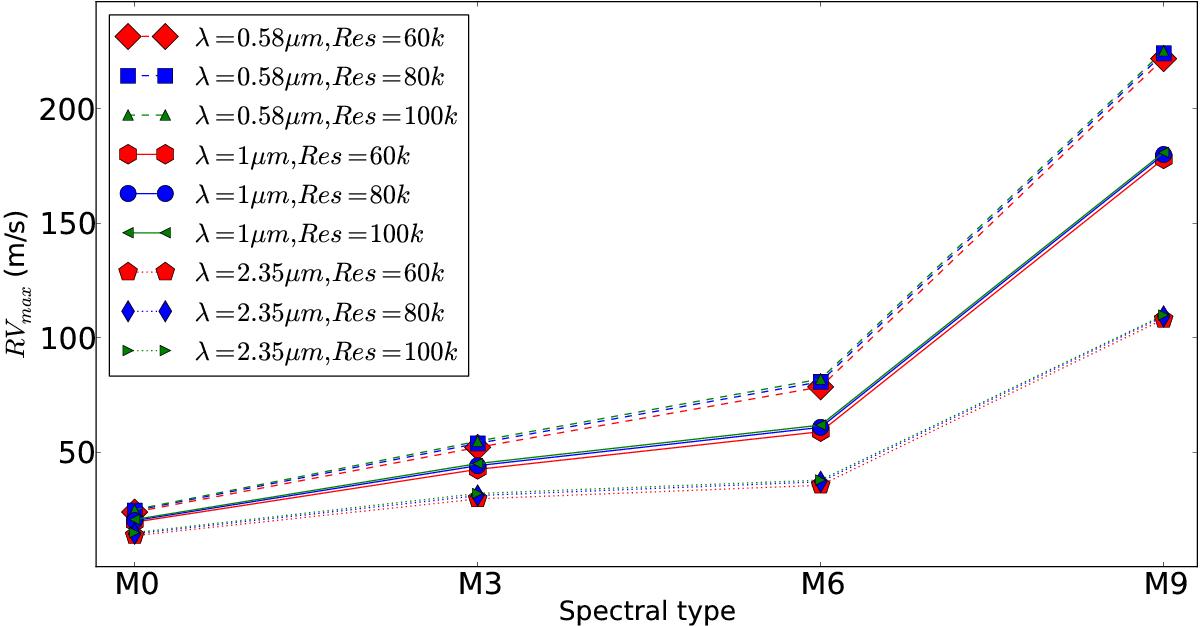
Peak-to-peak amplitude of the RV impact introduced by a 1% spot simulated by SOAP2.0 on M dwarfs of different spectral types and associated v sin i, of value 3.2, 5.7, 9.2, and 19 km s-1 for M0, M3, M6, and M9, respectively. The different symbols and line styles represent different observing wavelengths, and the different colors represent different observing resolutions.
Current usage metrics show cumulative count of Article Views (full-text article views including HTML views, PDF and ePub downloads, according to the available data) and Abstracts Views on Vision4Press platform.
Data correspond to usage on the plateform after 2015. The current usage metrics is available 48-96 hours after online publication and is updated daily on week days.
Initial download of the metrics may take a while.