Fig. 2
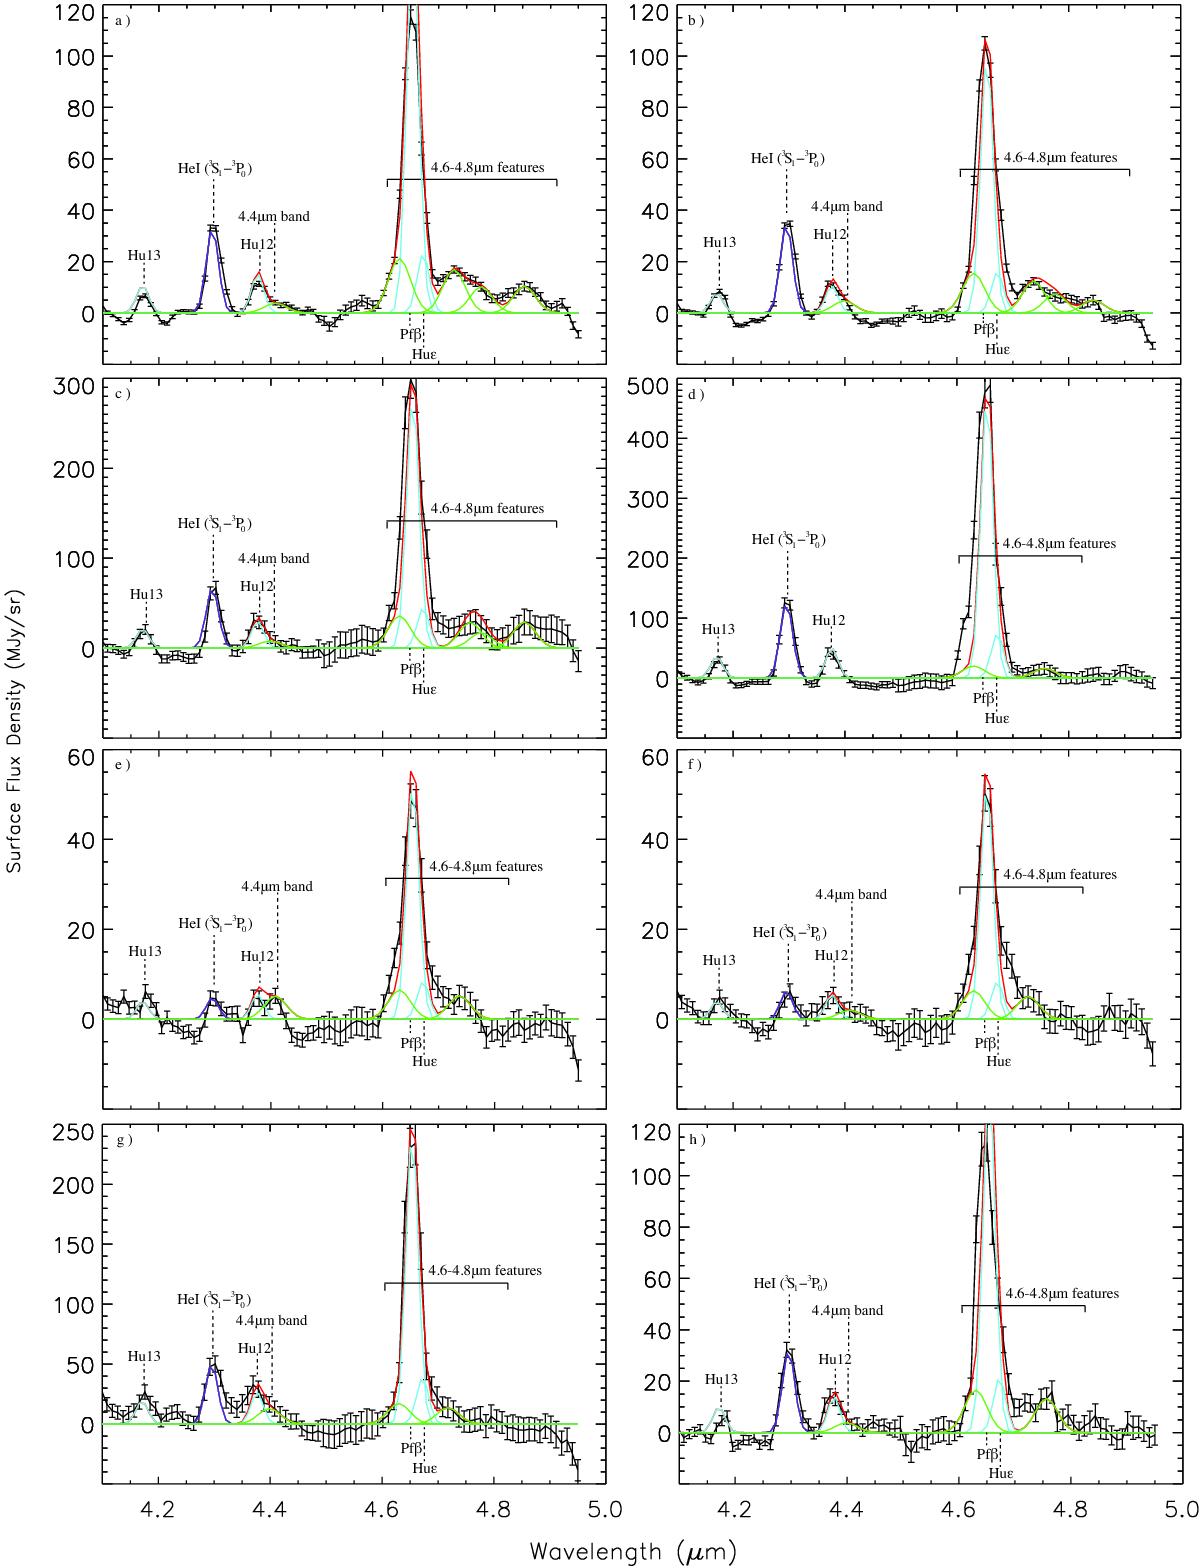
Close up of the C-D stretching region of the spectra of a) IRAS 12073-6233 obs. 1; b) IRAS 12073-6233 obs. 2; c) NGC 3603; d) M17b; e) W51 obs. 1; f) W51 obs. 2; g) M8; and h) G75.783+0.343. The fitting results for the spectra is shown in red, the black line is the observed spectra, the HI emission lines are fit in cyan, the HeI emission line is fit in navy, and PAD and Dn-PAH features are fit in green.
Current usage metrics show cumulative count of Article Views (full-text article views including HTML views, PDF and ePub downloads, according to the available data) and Abstracts Views on Vision4Press platform.
Data correspond to usage on the plateform after 2015. The current usage metrics is available 48-96 hours after online publication and is updated daily on week days.
Initial download of the metrics may take a while.