Fig. A.3
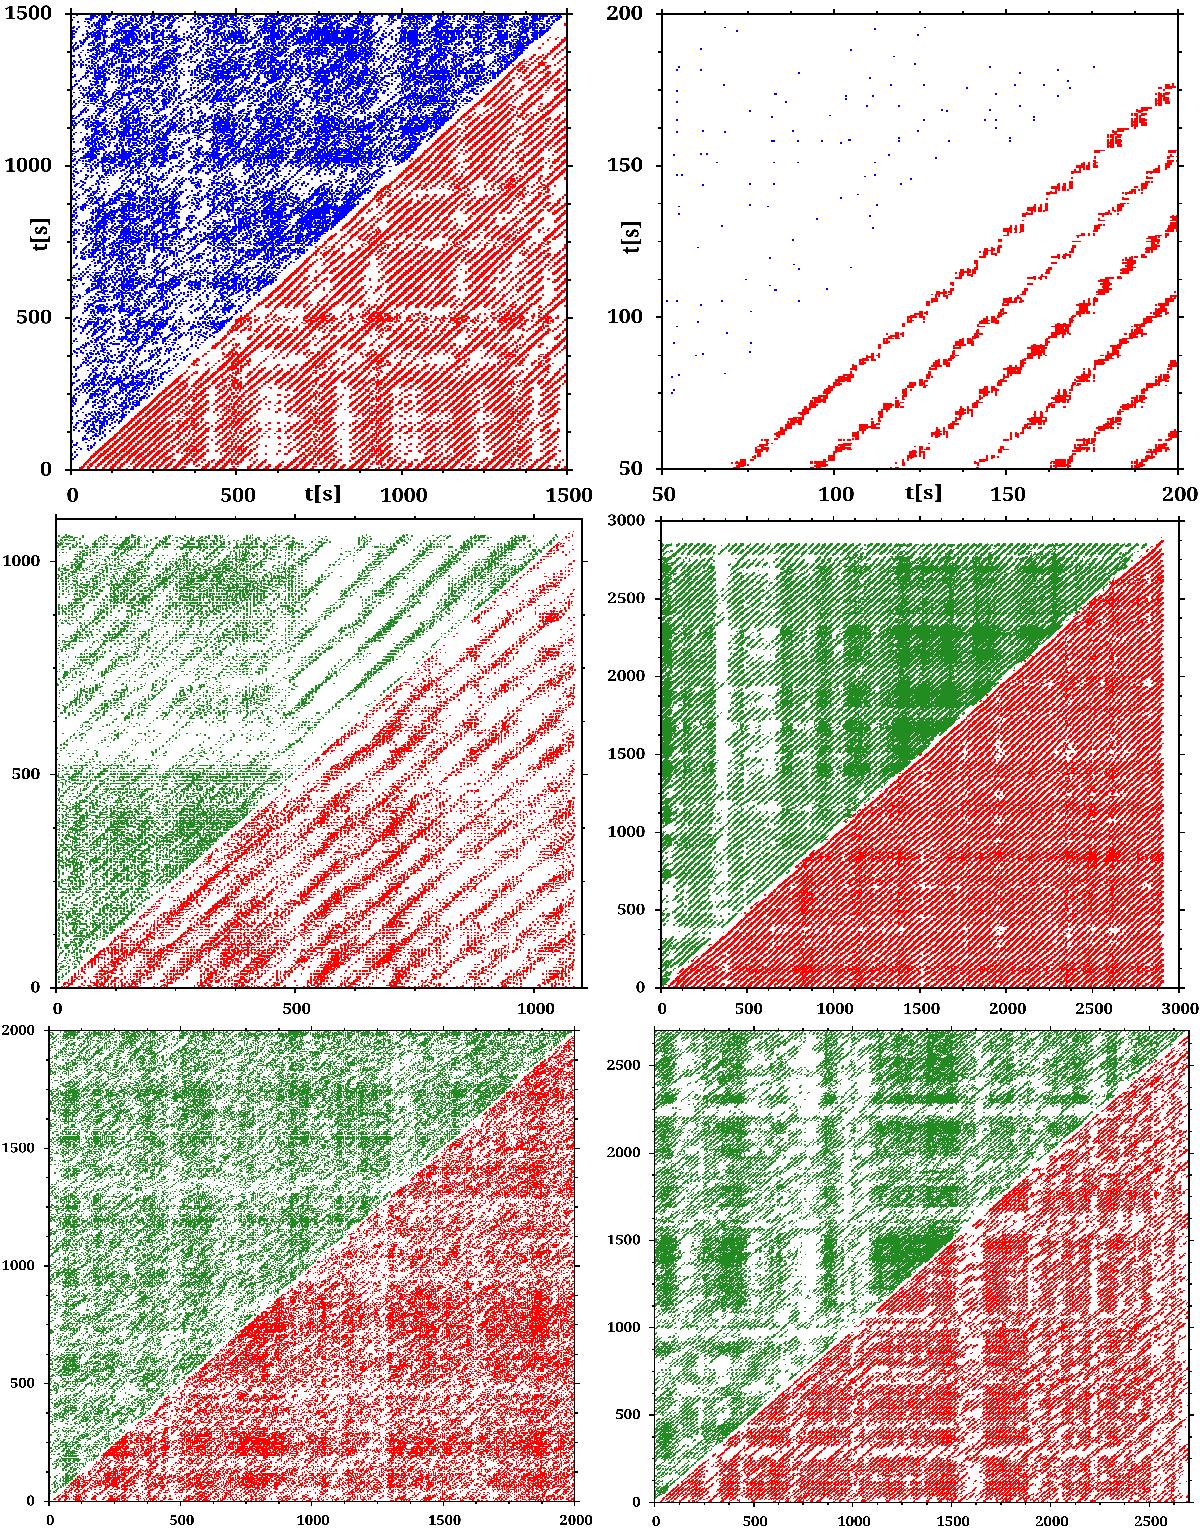
RP for several observations of IGR J17091-3624 from Table 1. 1. Row: left − SIMS/HIMS state 02-00 (left upper corner in blue) and ρ state 06-02 (right lower corner in red). Long diagonal lines appear in red RP. Right − the zoom of preceding plot. The diagonal lines are affected by the noise in such a way that the apparently long lines are composed of shorter square-shaped pieces. Next rows: in the red right lower halves of each plot RP are plotted for observations 04-01 (2. row left, IVS state), 04-02 (2. row right, ρ-state), 05-02 (3. row left, SIMS state) and 07-01 (3. row right, ρ-state). In the left upper half of each plot one of the corresponding surrogates is shown in green.
Current usage metrics show cumulative count of Article Views (full-text article views including HTML views, PDF and ePub downloads, according to the available data) and Abstracts Views on Vision4Press platform.
Data correspond to usage on the plateform after 2015. The current usage metrics is available 48-96 hours after online publication and is updated daily on week days.
Initial download of the metrics may take a while.