Fig. A.1
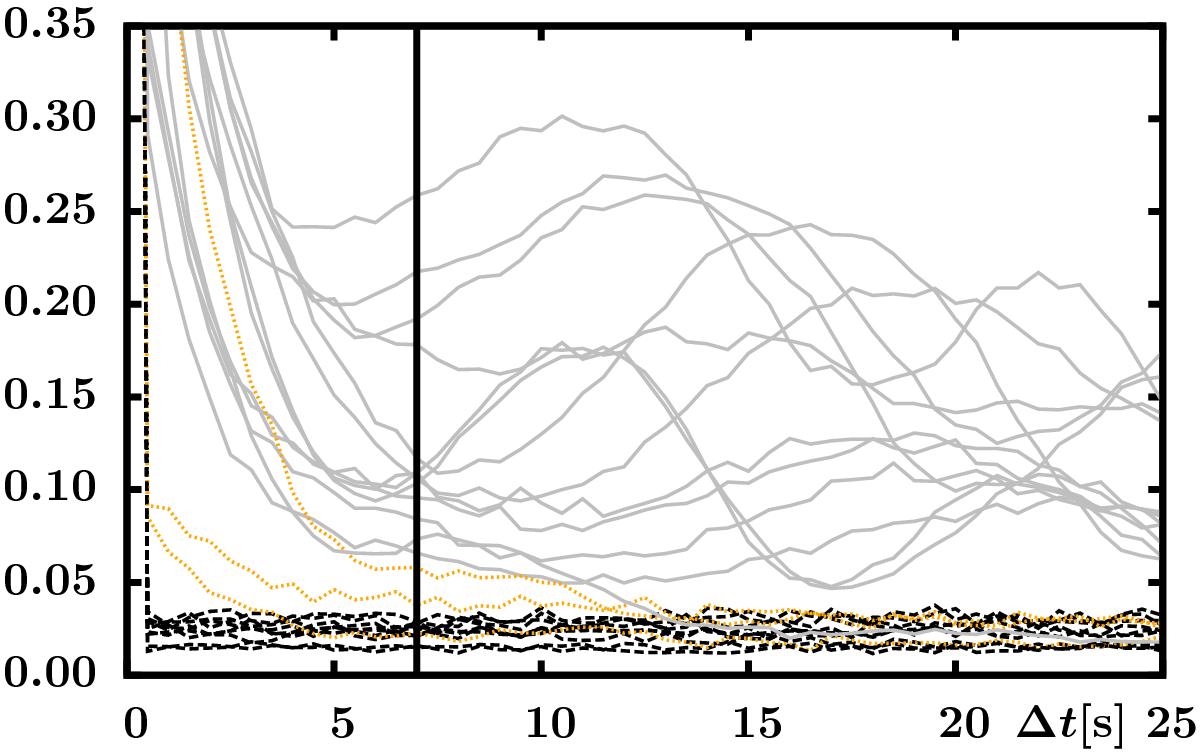
The dependence of mutual information on the time delay Δt for the set of observations of IGR J17091-3624 listed in Table 1. Observations with low and constant mutual information are plotted with black dashed lines, observations with oscillating mutual information are plotted with grey solid lines and those with intermediate behaviour are plotted by yellow dotted lines. The vertical line indicates the chosen time delay for our analysis.
Current usage metrics show cumulative count of Article Views (full-text article views including HTML views, PDF and ePub downloads, according to the available data) and Abstracts Views on Vision4Press platform.
Data correspond to usage on the plateform after 2015. The current usage metrics is available 48-96 hours after online publication and is updated daily on week days.
Initial download of the metrics may take a while.