Fig. B.5
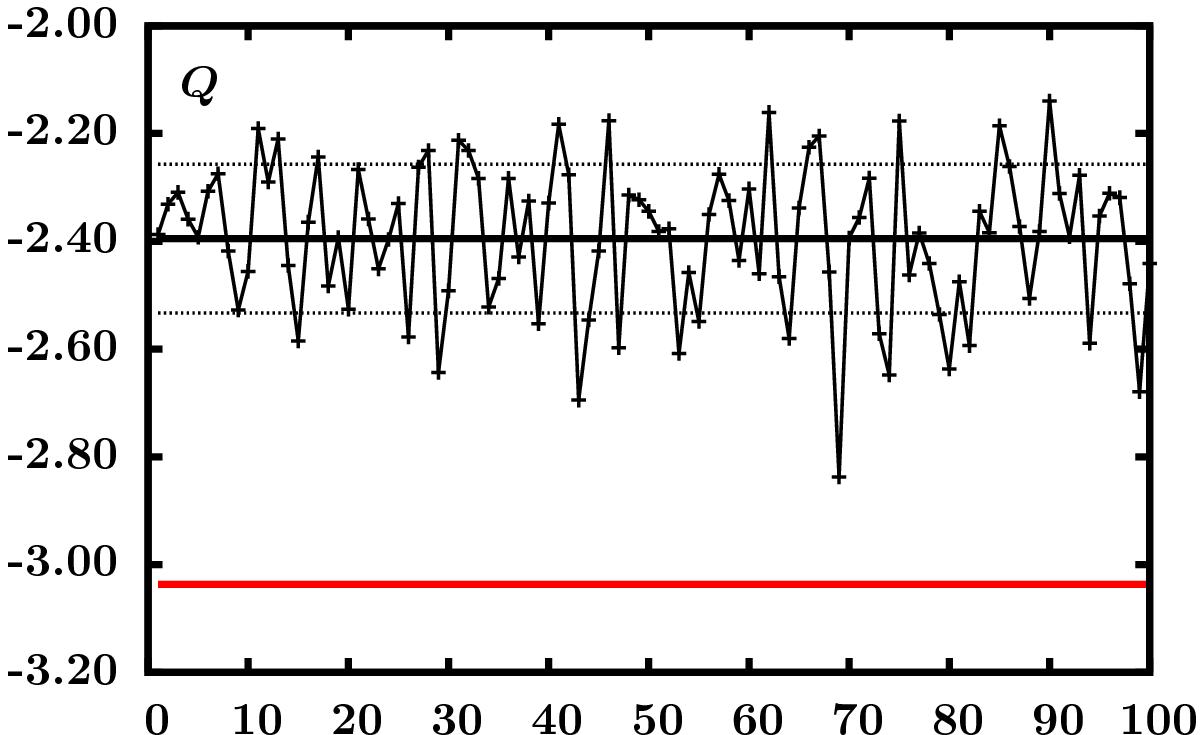
Comparison of Q for observation 06-02 (indicated by the horizontal thick red line) and its hundred surrogates (number of surrogate is on the x-axis) computed for the same recurrence parameters (ϵ = 3.25,m = 10,Δt = 14dt). The mean value ![]() and the standard deviation of the ensemble of surrogates is indicated by horizontal lines.
and the standard deviation of the ensemble of surrogates is indicated by horizontal lines.
Current usage metrics show cumulative count of Article Views (full-text article views including HTML views, PDF and ePub downloads, according to the available data) and Abstracts Views on Vision4Press platform.
Data correspond to usage on the plateform after 2015. The current usage metrics is available 48-96 hours after online publication and is updated daily on week days.
Initial download of the metrics may take a while.