Free Access
Fig. A.6
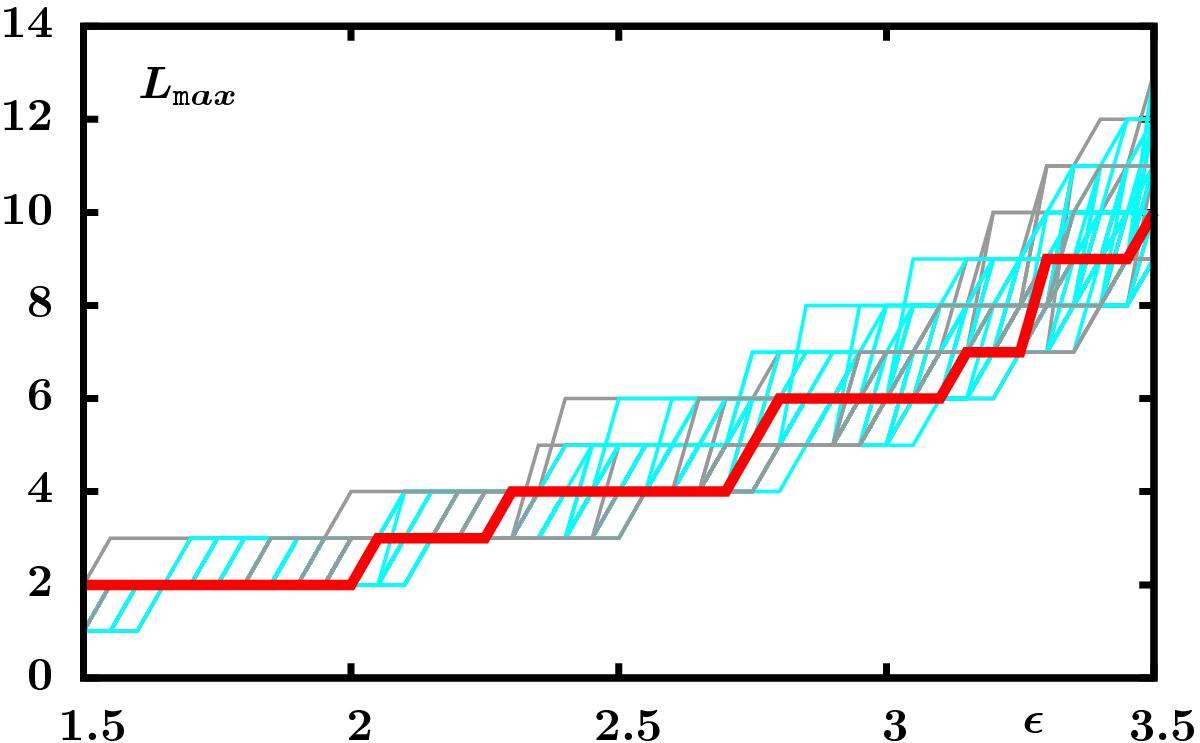
Dependence of the longest diagonal line Lmax given in points on the recurrence threshold ϵ for the observation 05-02 (thick red line). The ensemble of 100 surrogates are shown in grey and the ensemble of shuffled surrogates are shown in cyan.
Current usage metrics show cumulative count of Article Views (full-text article views including HTML views, PDF and ePub downloads, according to the available data) and Abstracts Views on Vision4Press platform.
Data correspond to usage on the plateform after 2015. The current usage metrics is available 48-96 hours after online publication and is updated daily on week days.
Initial download of the metrics may take a while.