Fig. 6
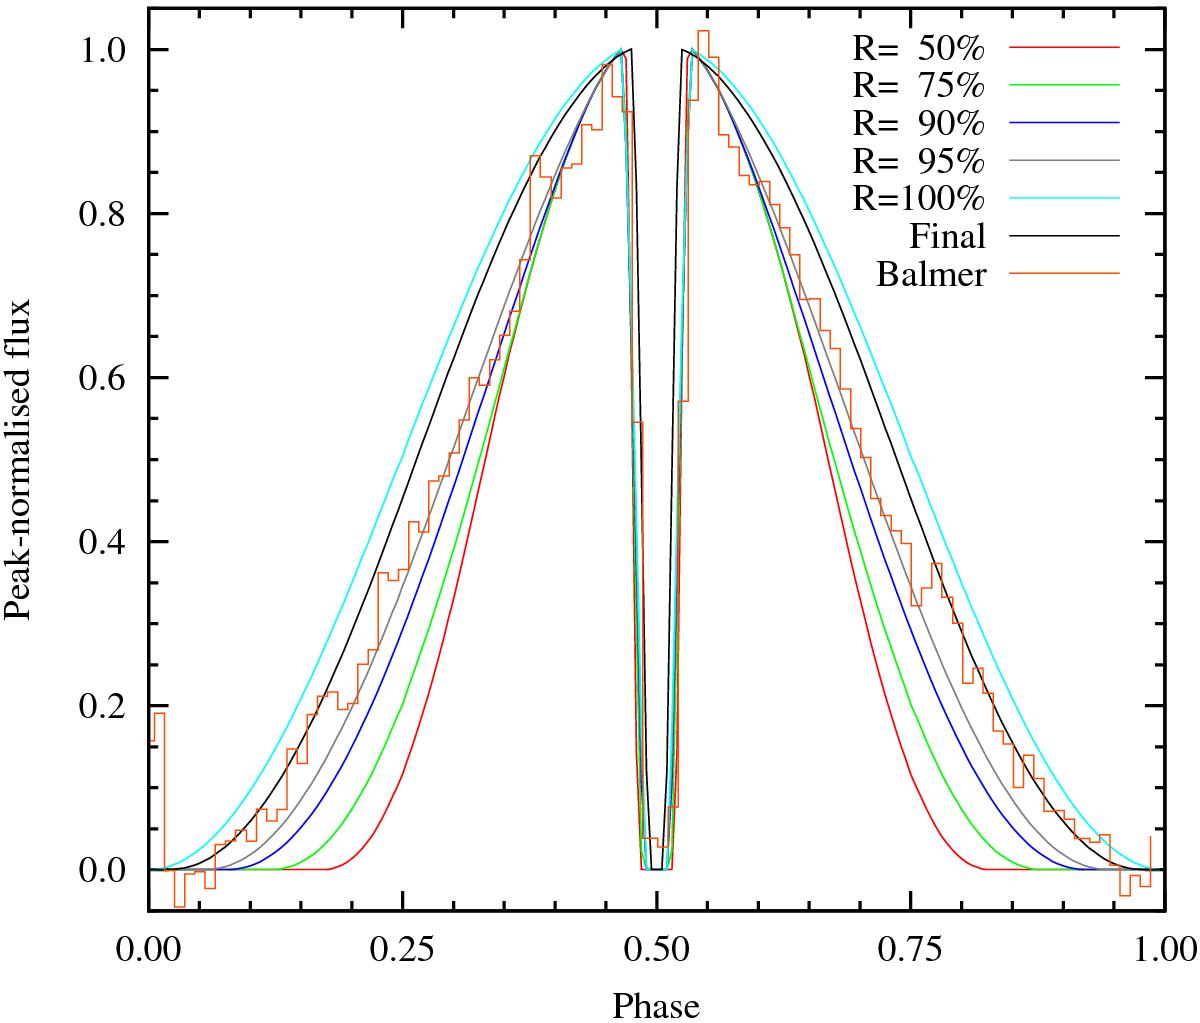
Normalised phase profiles from models of emission from hotspots of various radii (curves). The ‘final’ model includes edge effects and limb darkening. Also shown, are the observed phase profiles from the sum of Balmer and metal lines. It is clear from comparing the model and observed profiles that the size of the hotspot must be between 95 and 100%.
Current usage metrics show cumulative count of Article Views (full-text article views including HTML views, PDF and ePub downloads, according to the available data) and Abstracts Views on Vision4Press platform.
Data correspond to usage on the plateform after 2015. The current usage metrics is available 48-96 hours after online publication and is updated daily on week days.
Initial download of the metrics may take a while.