Fig. 6
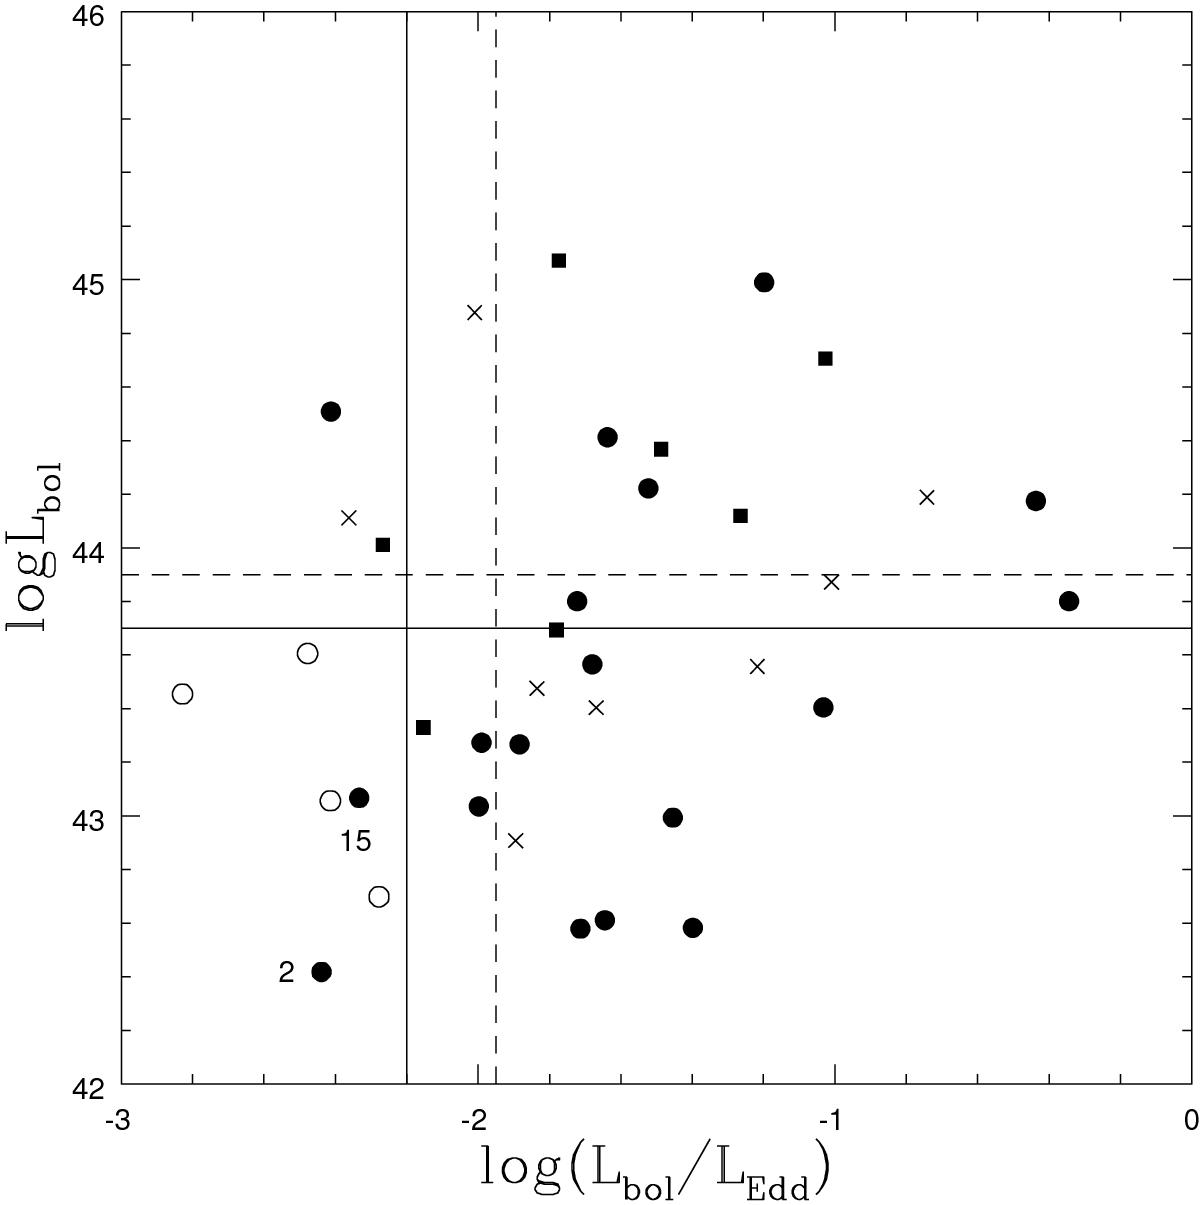
Eddington ratio vs. bolometric luminosity plot. The open circles denote the unabsorbed Sy2s, and the filled ones the absorbed ones. Squares denote the Compton-thick sources. The solid lines are the empirical thresholds found in the current work below which most of our unobscured Sy2s are found. The dashed lines are the empirical thresholds shown in Marinucci et al. (2012) that separate HBLR and non-HBLR Sy2s.
Current usage metrics show cumulative count of Article Views (full-text article views including HTML views, PDF and ePub downloads, according to the available data) and Abstracts Views on Vision4Press platform.
Data correspond to usage on the plateform after 2015. The current usage metrics is available 48-96 hours after online publication and is updated daily on week days.
Initial download of the metrics may take a while.