Fig. 5
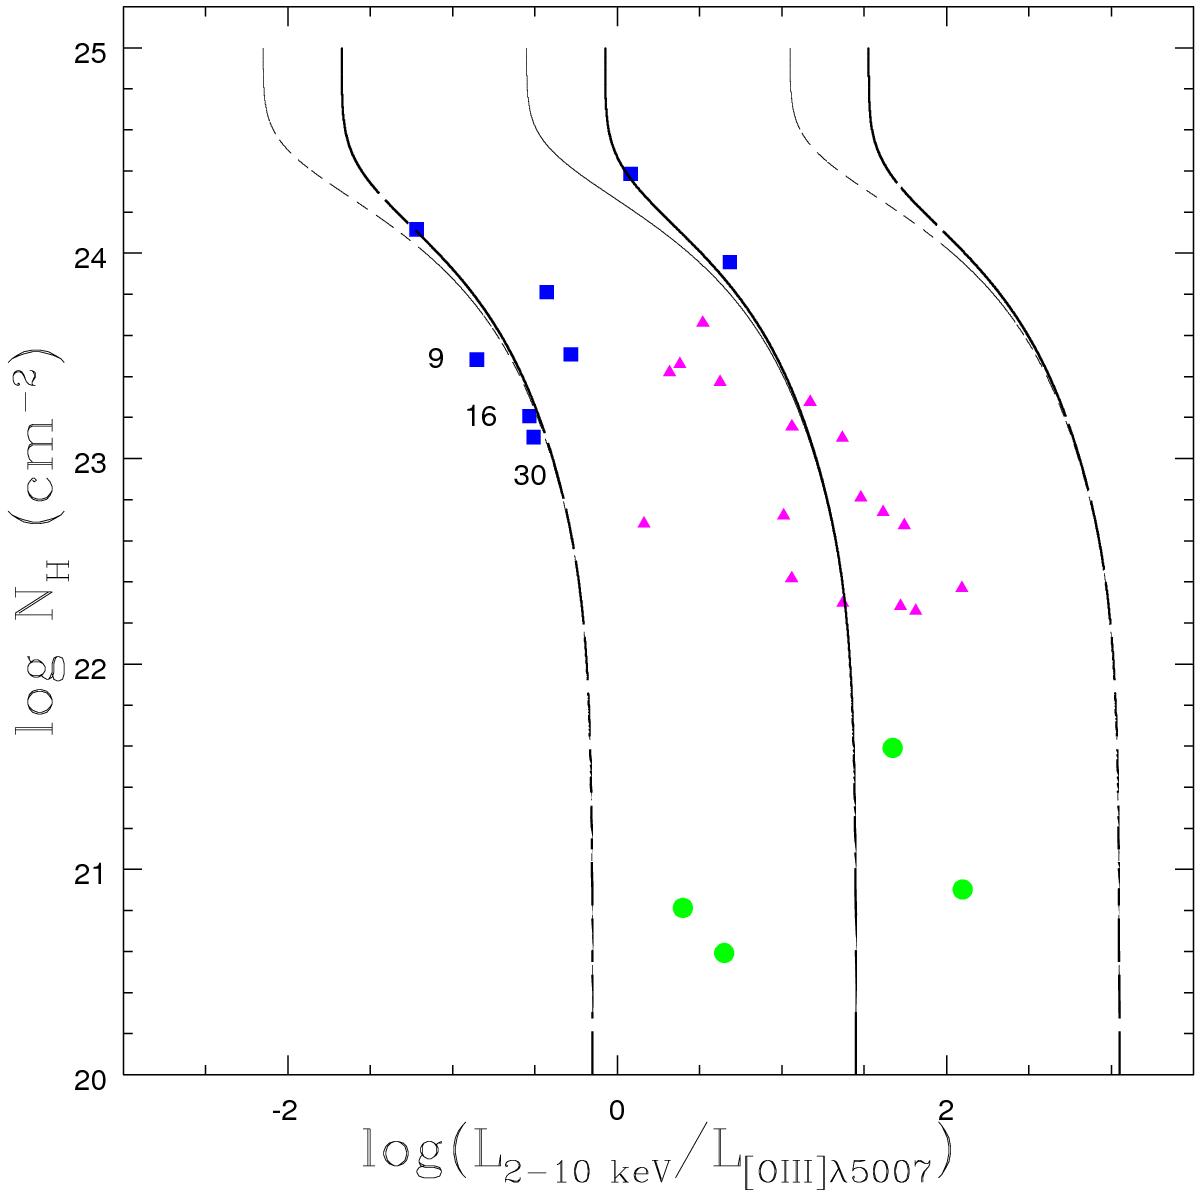
Distribution of the NH values as a function of the L2−10 keV/L[OIII] ratio. Color- and shape-coding as in Fig. 1. The solid lines represent the mean NH vs. L2−10 keV/L[OIII] relation followed by the Seyfert-1 sample in Akylas & Georgantopoulos (2009) assuming a photon index of 1.8 and 3% (thin line: 1%) reflected radiation (see also Maiolino et al. 1998; Cappi et al. 2006), while the dashed lines represent the ±3σ dispersion. The numbers of interesting sources correspond to the sequence numbers in Tables 1 and 2.
Current usage metrics show cumulative count of Article Views (full-text article views including HTML views, PDF and ePub downloads, according to the available data) and Abstracts Views on Vision4Press platform.
Data correspond to usage on the plateform after 2015. The current usage metrics is available 48-96 hours after online publication and is updated daily on week days.
Initial download of the metrics may take a while.