Fig. 4
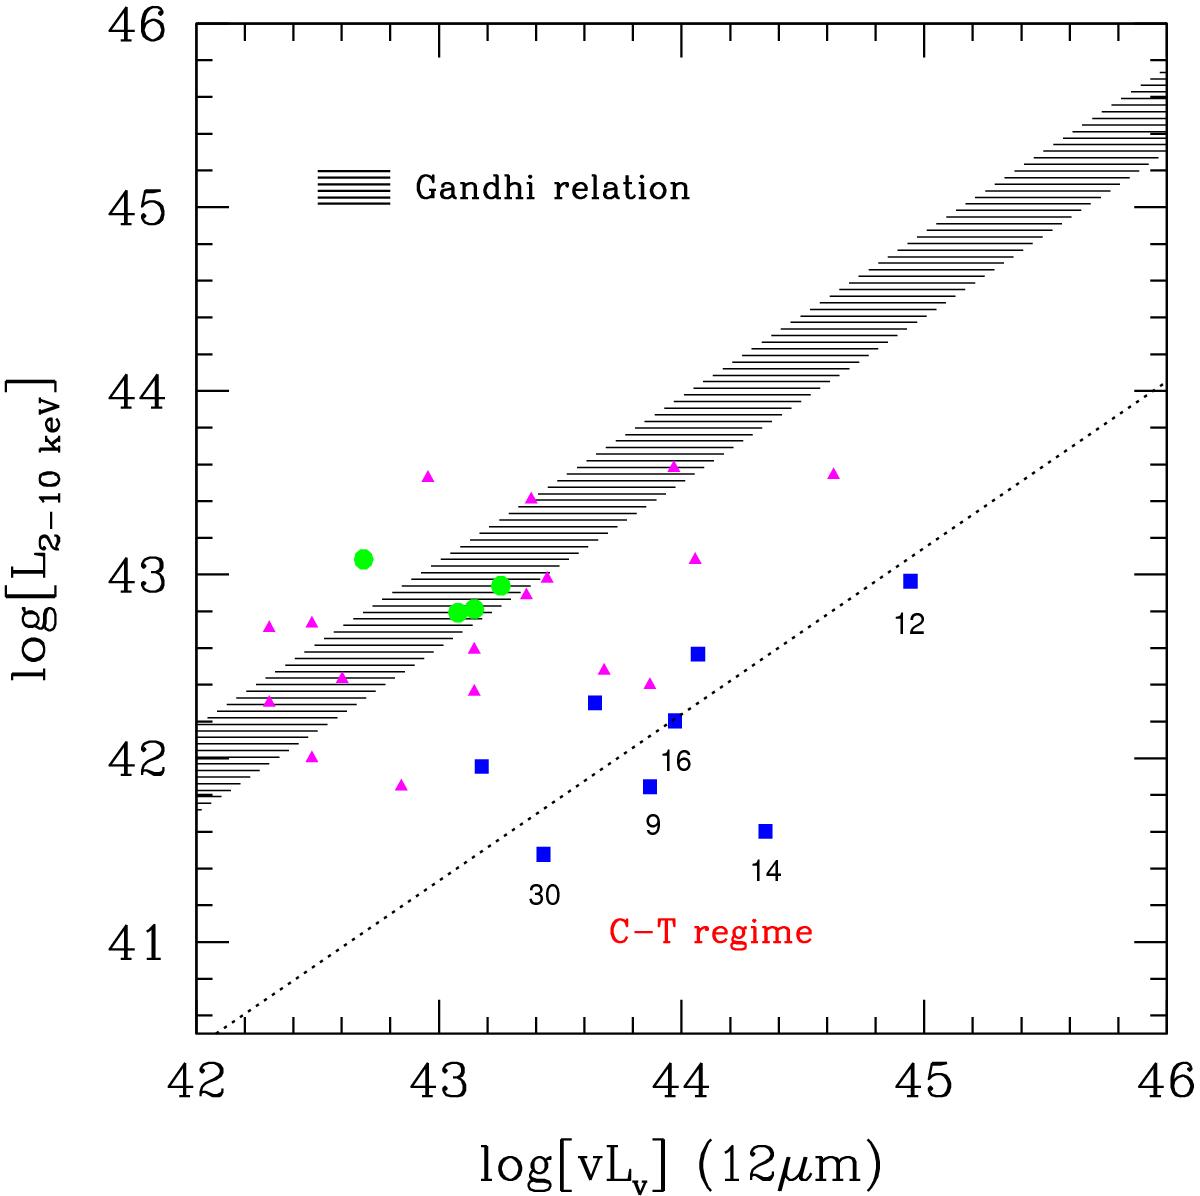
Absorbed X-ray (2−10 keV) X-ray luminosity against the 12 μm luminosity. Color- and shape-coding as in Fig. 1. The typical errors are on the order of 30% and 20% for the IR and X-ray luminosity, respectively, including the uncertainties in the model fitting. The hatched diagram represents the 1σ envelope of the local (Gandhi et al. 2009) relation. The dotted line corresponds to a factor of 30 lower X-ray luminosity as is typical in many Compton-thick nuclei. The numbers of interesting sources correspond to the sequence numbers in Tables 1 and 2.
Current usage metrics show cumulative count of Article Views (full-text article views including HTML views, PDF and ePub downloads, according to the available data) and Abstracts Views on Vision4Press platform.
Data correspond to usage on the plateform after 2015. The current usage metrics is available 48-96 hours after online publication and is updated daily on week days.
Initial download of the metrics may take a while.