Free Access
Fig. 3
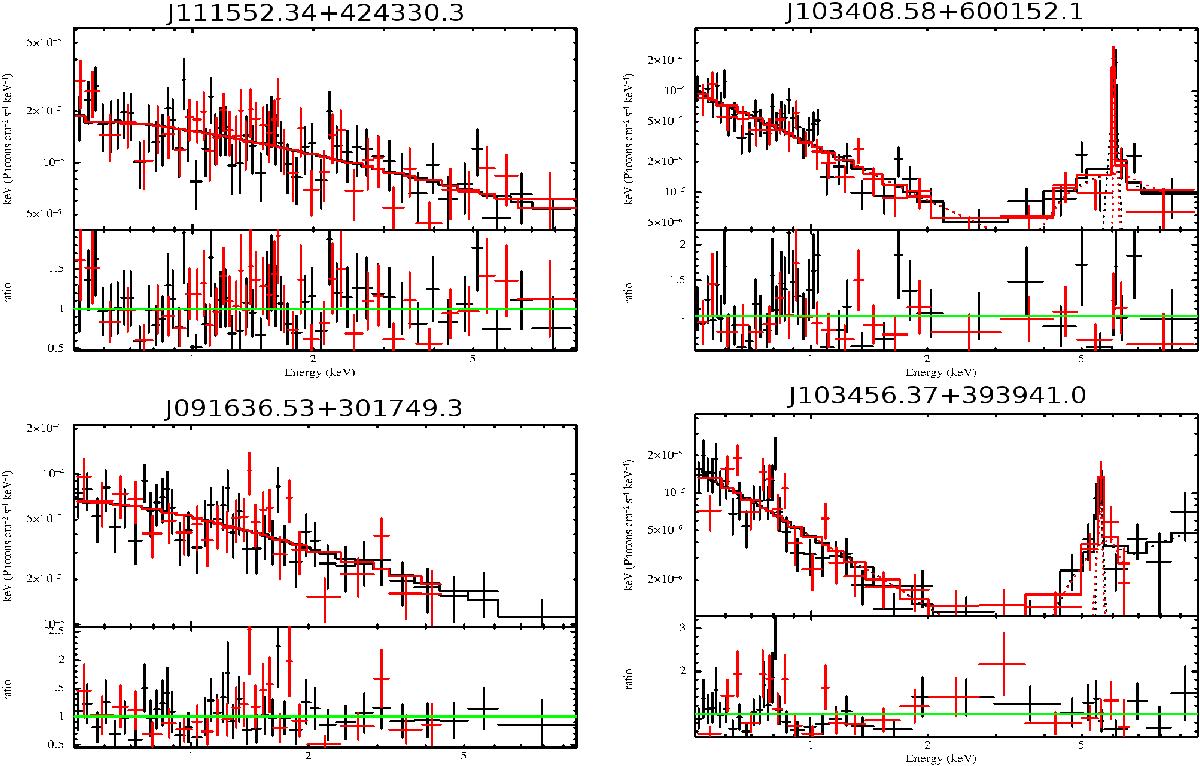
Left panels: X-ray spectral modeling of two unobscured sources with a single power law. Right panels: X-ray spectral modeling of two candidate Compton-thick sources with a double power law and an iron FeKα line. The black points and the black line denote the PN detector, while the red line denotes the merged MOS1 and MOS2.
Current usage metrics show cumulative count of Article Views (full-text article views including HTML views, PDF and ePub downloads, according to the available data) and Abstracts Views on Vision4Press platform.
Data correspond to usage on the plateform after 2015. The current usage metrics is available 48-96 hours after online publication and is updated daily on week days.
Initial download of the metrics may take a while.