Fig. 2
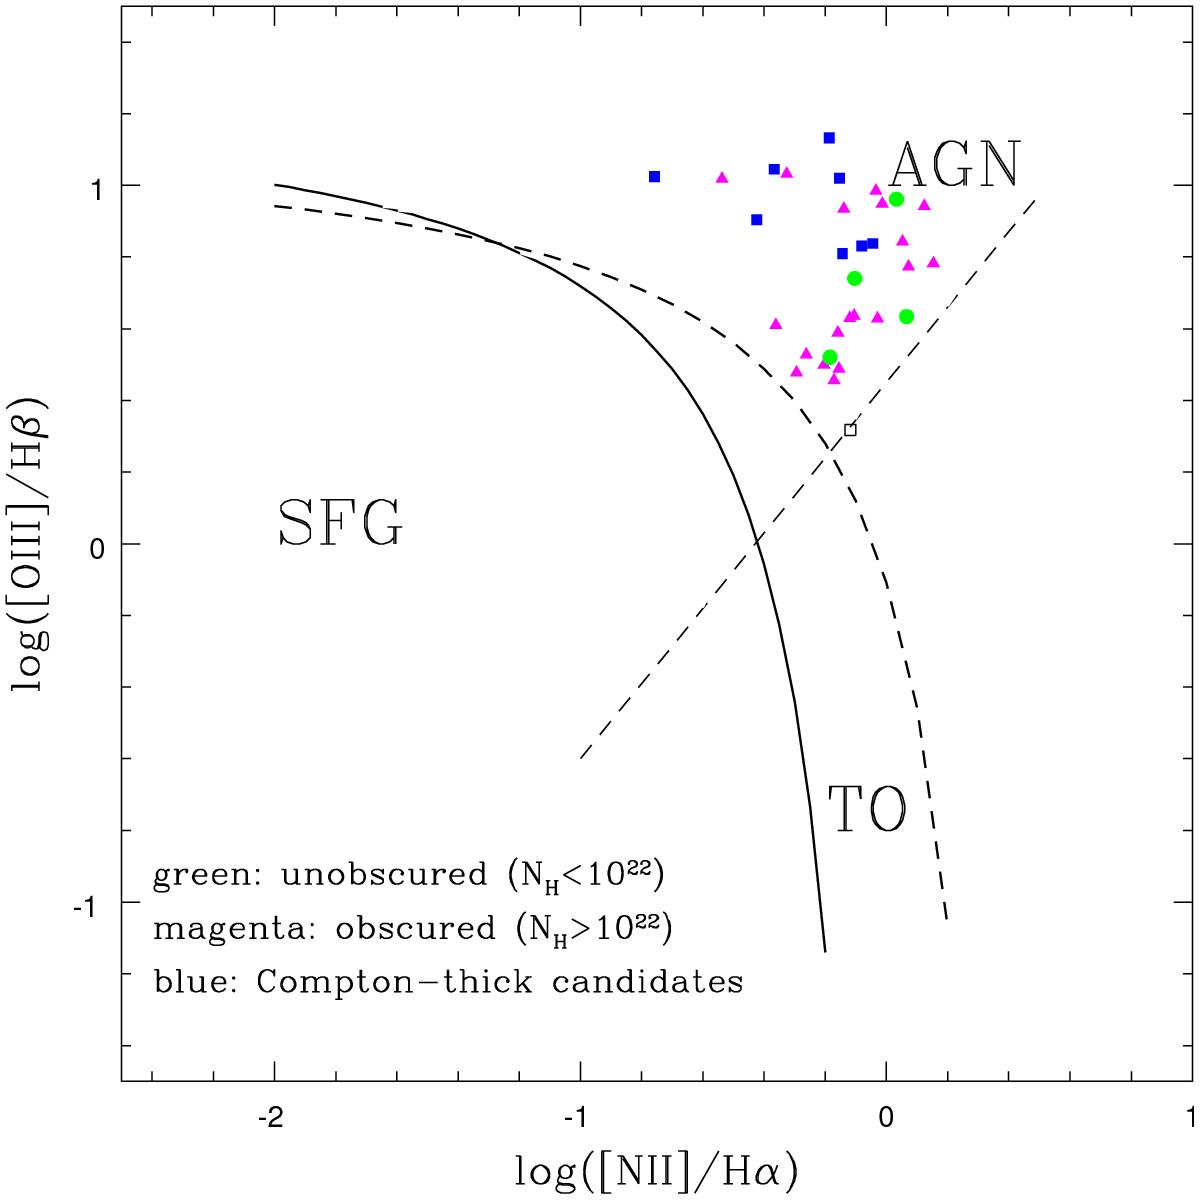
BPT diagnostic diagram for the Sy2 sample. The various levels of obscuration are color-coded. The continuous curve denotes the star-forming − AGN separation line of Kauffmann et al. (2003), and the thick dashed curve the respective line of Kewley et al. (2001). The dashed straight line denotes the LINER − AGN threshold by Schawinski et al. (2007). Composite or transition objects (TO) between the AGN and star-forming phase are found in the area between the two curves. The open square indicates the position of a discarded LINER.
Current usage metrics show cumulative count of Article Views (full-text article views including HTML views, PDF and ePub downloads, according to the available data) and Abstracts Views on Vision4Press platform.
Data correspond to usage on the plateform after 2015. The current usage metrics is available 48-96 hours after online publication and is updated daily on week days.
Initial download of the metrics may take a while.