Fig. 8
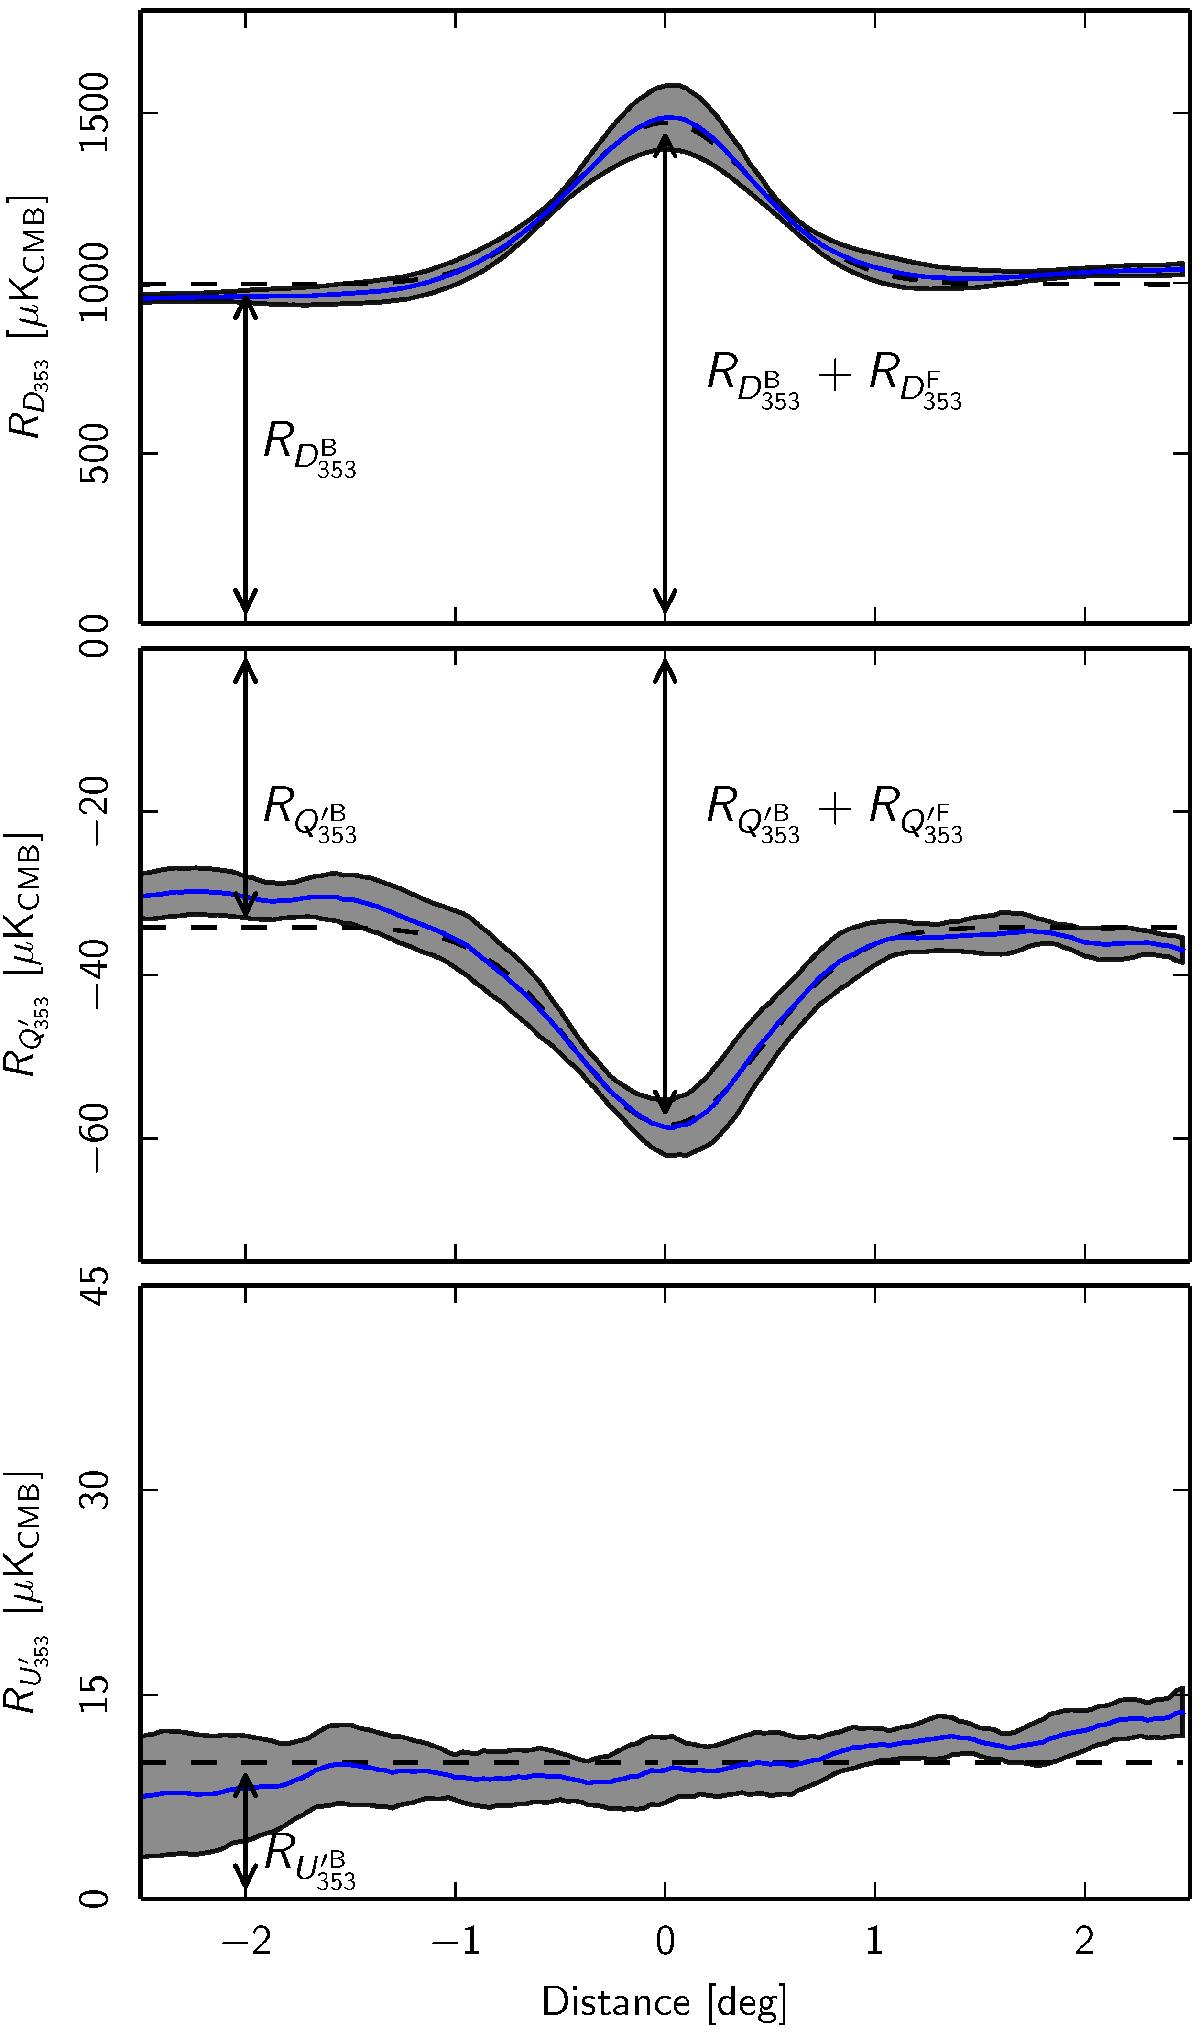
Radial profiles of the mean stacked PlanckD353, ![]() , and
, and ![]() images as functions of distance from the centre of the filament (blue line). The grey shaded region shows the 1σ dispersion from the data values at a given radial distance from the filament axis that we average. The dashed line is the Gaussian fit to the filament profile plus a constant background emission.
images as functions of distance from the centre of the filament (blue line). The grey shaded region shows the 1σ dispersion from the data values at a given radial distance from the filament axis that we average. The dashed line is the Gaussian fit to the filament profile plus a constant background emission.
Current usage metrics show cumulative count of Article Views (full-text article views including HTML views, PDF and ePub downloads, according to the available data) and Abstracts Views on Vision4Press platform.
Data correspond to usage on the plateform after 2015. The current usage metrics is available 48-96 hours after online publication and is updated daily on week days.
Initial download of the metrics may take a while.