Fig. 2
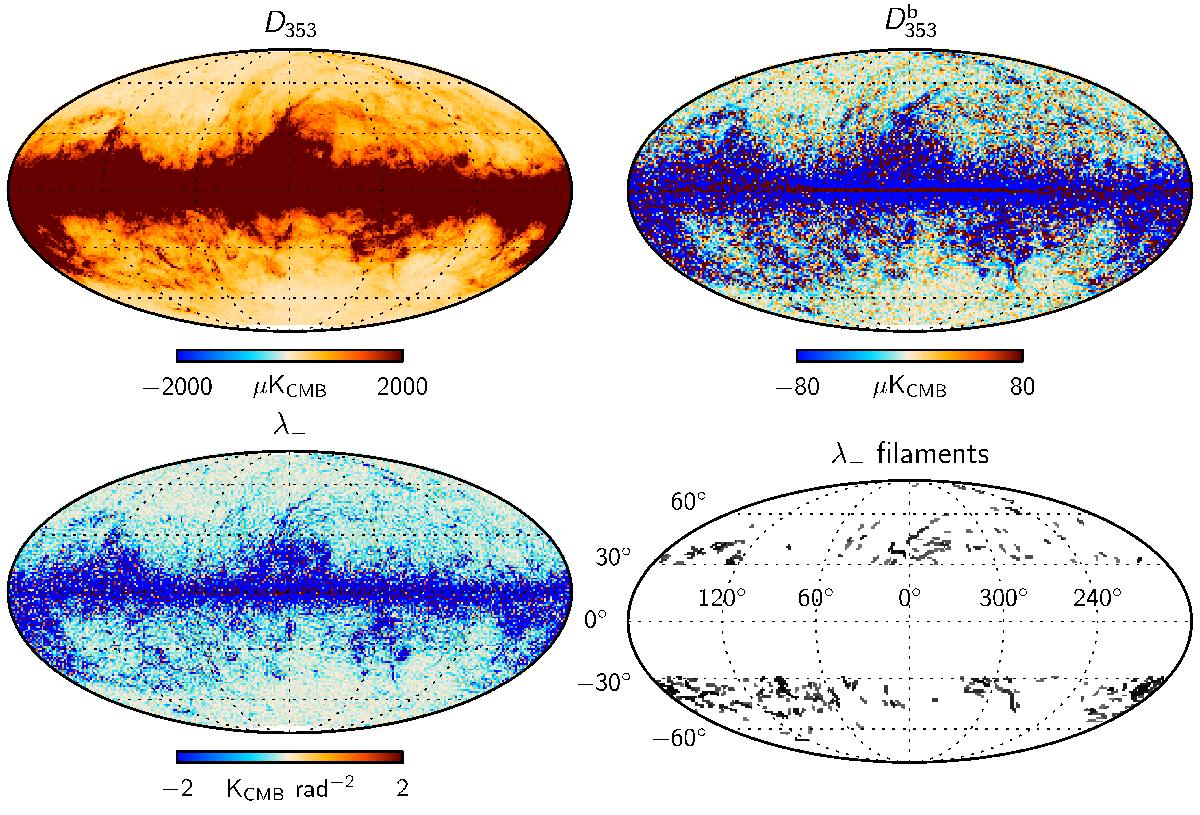
Data processing steps implemented to identify filaments from the Planck data. We start with the PlanckD353 map (upper left panel) smoothed at 15′ resolution. The bandpass-filtered ![]() map (upper right panel) is produced using the spline wavelet decomposition, retaining only the scales between ℓ = 30 and 300. The lower eigenvalue map of the Hessian matrix, λ−, is shown in the lower left panel. Structures identified in the high-latitude sky λ− map are shown in the lower right panel. The superimposed graticule is plotted in each image and labelled only on the lower right panel. It shows lines of constant longitude separated by 60° and lines of constant latitude separated by 30°. The same graticule is used in all plots of the paper.
map (upper right panel) is produced using the spline wavelet decomposition, retaining only the scales between ℓ = 30 and 300. The lower eigenvalue map of the Hessian matrix, λ−, is shown in the lower left panel. Structures identified in the high-latitude sky λ− map are shown in the lower right panel. The superimposed graticule is plotted in each image and labelled only on the lower right panel. It shows lines of constant longitude separated by 60° and lines of constant latitude separated by 30°. The same graticule is used in all plots of the paper.
Current usage metrics show cumulative count of Article Views (full-text article views including HTML views, PDF and ePub downloads, according to the available data) and Abstracts Views on Vision4Press platform.
Data correspond to usage on the plateform after 2015. The current usage metrics is available 48-96 hours after online publication and is updated daily on week days.
Initial download of the metrics may take a while.