Free Access
Fig. 12
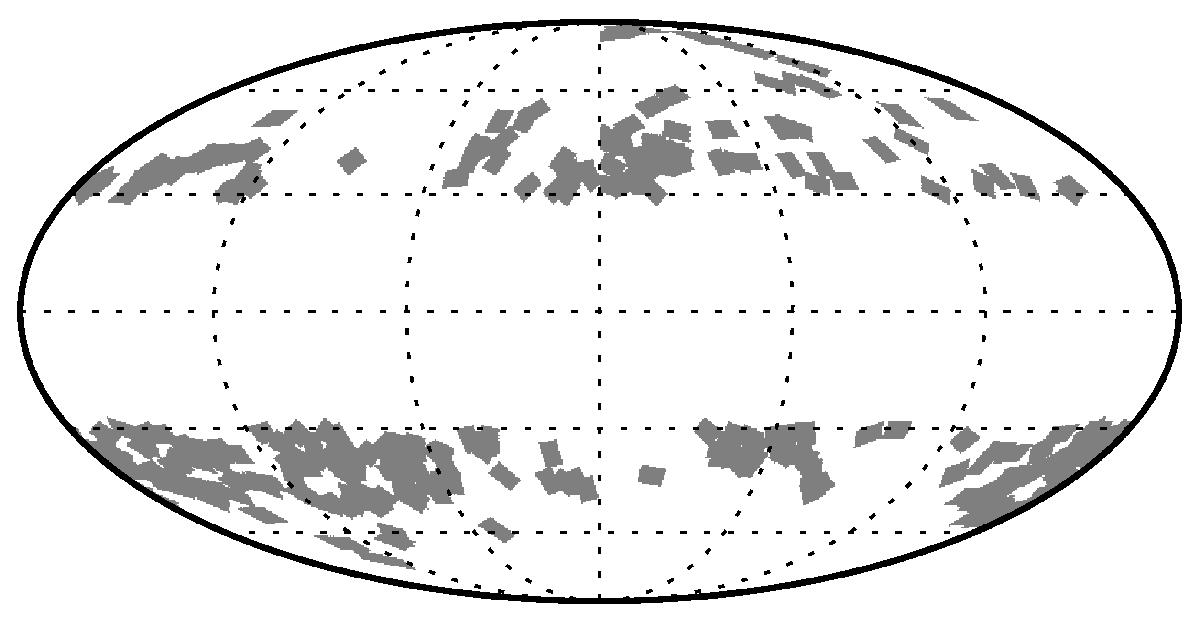
Map of the selected pixels (grey colour) used in the stacking analysis. It covers 28% of the high-latitude sky. Each tile in the image is a 7° × 5° patch around the filament centre and rotated by ![]() .
.
Current usage metrics show cumulative count of Article Views (full-text article views including HTML views, PDF and ePub downloads, according to the available data) and Abstracts Views on Vision4Press platform.
Data correspond to usage on the plateform after 2015. The current usage metrics is available 48-96 hours after online publication and is updated daily on week days.
Initial download of the metrics may take a while.