Fig. 1
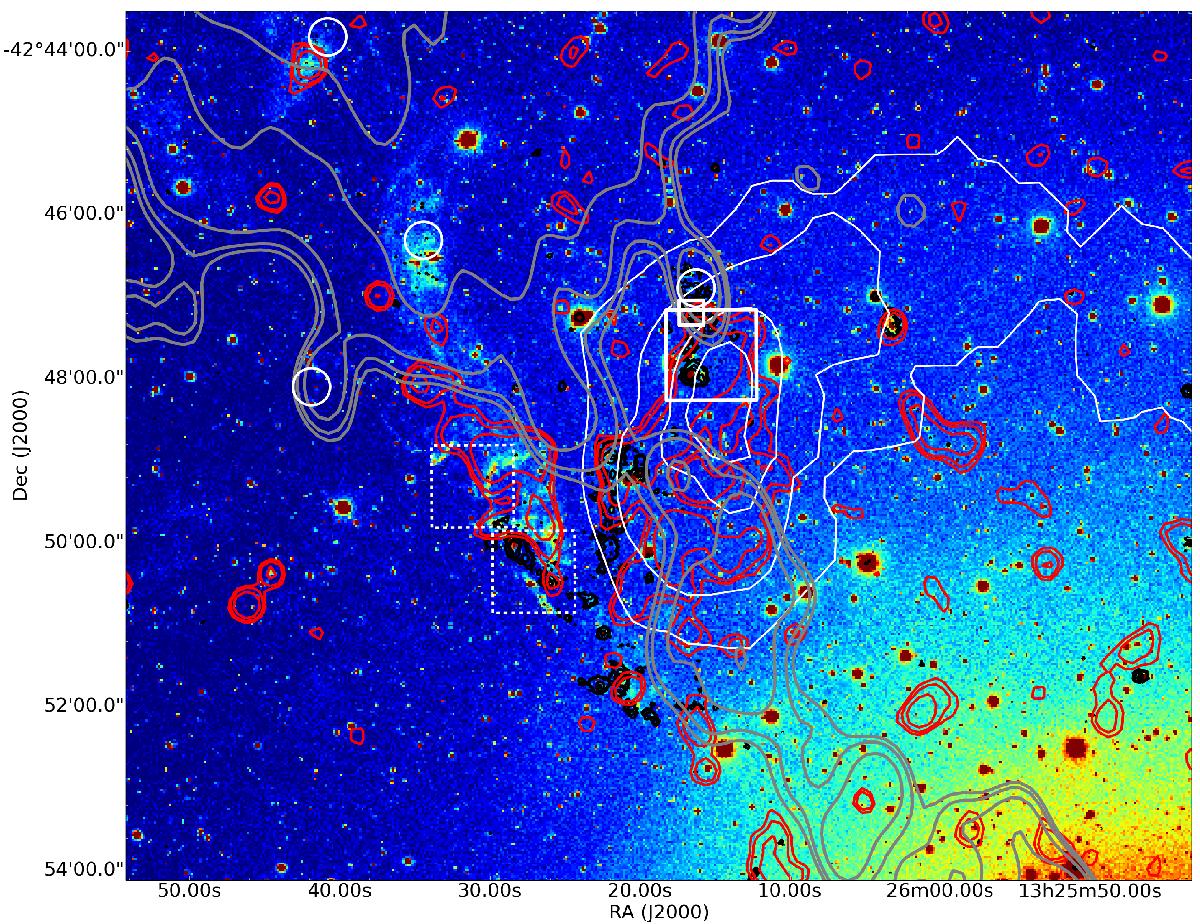
Hα emission of the northern region of Centaurus A with CTIO. We overlaid the H i emission (VLA; white contours), the 250μm emission (Herschel; red contours), the FUV emission (GALEX; black contours) and the radio continuum (ATCA; grey contours; kindly provided by R. Morganti). The white boxes indicate the location of CO detections with SEST (large box) and ATCA (small box), the dashed boxes are the FOV of MUSE data and the white circles are the positions that were observed with ALMA.
Current usage metrics show cumulative count of Article Views (full-text article views including HTML views, PDF and ePub downloads, according to the available data) and Abstracts Views on Vision4Press platform.
Data correspond to usage on the plateform after 2015. The current usage metrics is available 48-96 hours after online publication and is updated daily on week days.
Initial download of the metrics may take a while.