Fig. 6
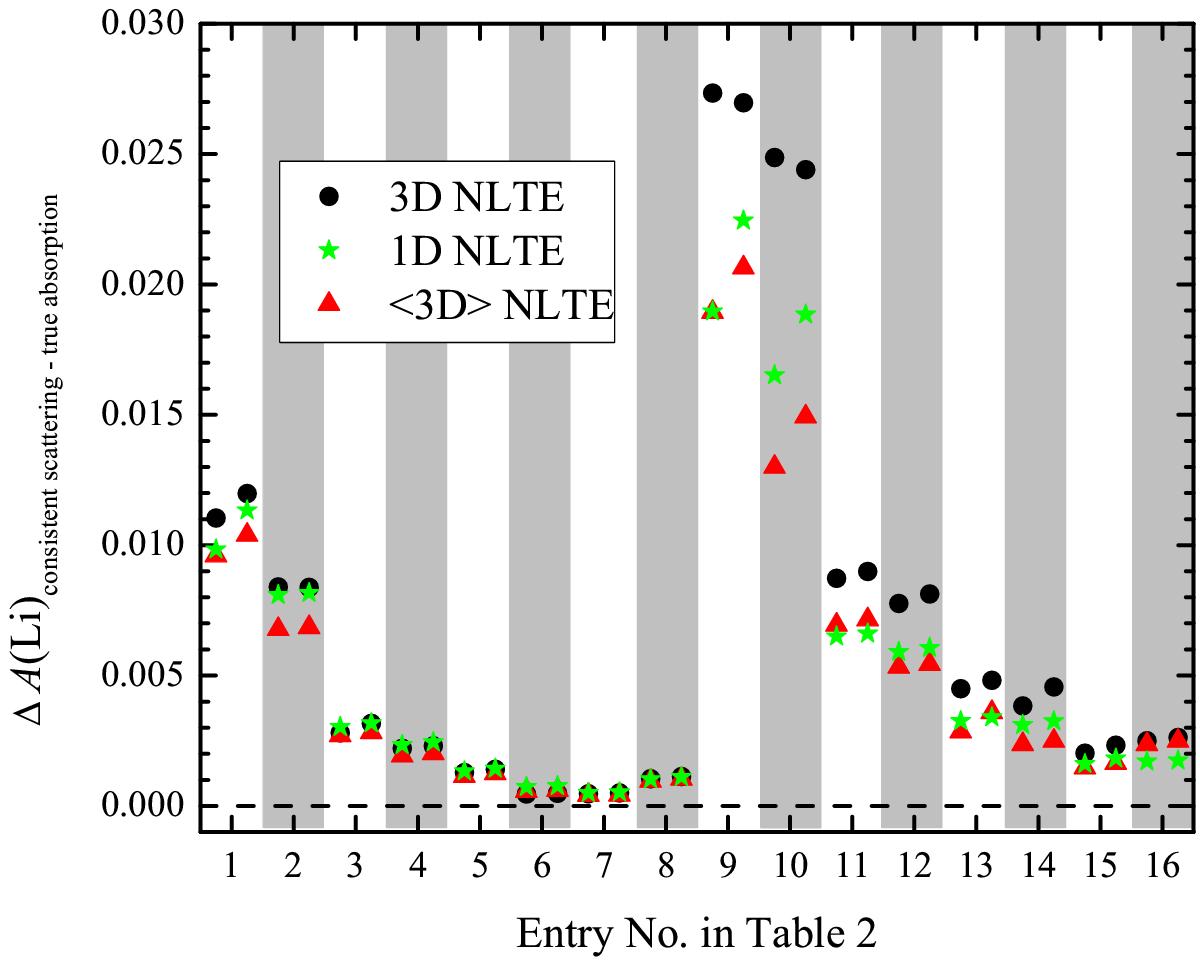
Changes in A(Li) when different treatments of continuum scattering are applied in calculations of the departure coefficients (coherent scattering versus true absorption). Differently shaded areas represent different model atmospheres as they are listed in Table 2. Symbols on the left side of each shaded region represent spectral lines with W = 0.5 pm, while symbols on the right represent those with W = 8.0 pm.
Current usage metrics show cumulative count of Article Views (full-text article views including HTML views, PDF and ePub downloads, according to the available data) and Abstracts Views on Vision4Press platform.
Data correspond to usage on the plateform after 2015. The current usage metrics is available 48-96 hours after online publication and is updated daily on week days.
Initial download of the metrics may take a while.