Free Access
Fig. 7
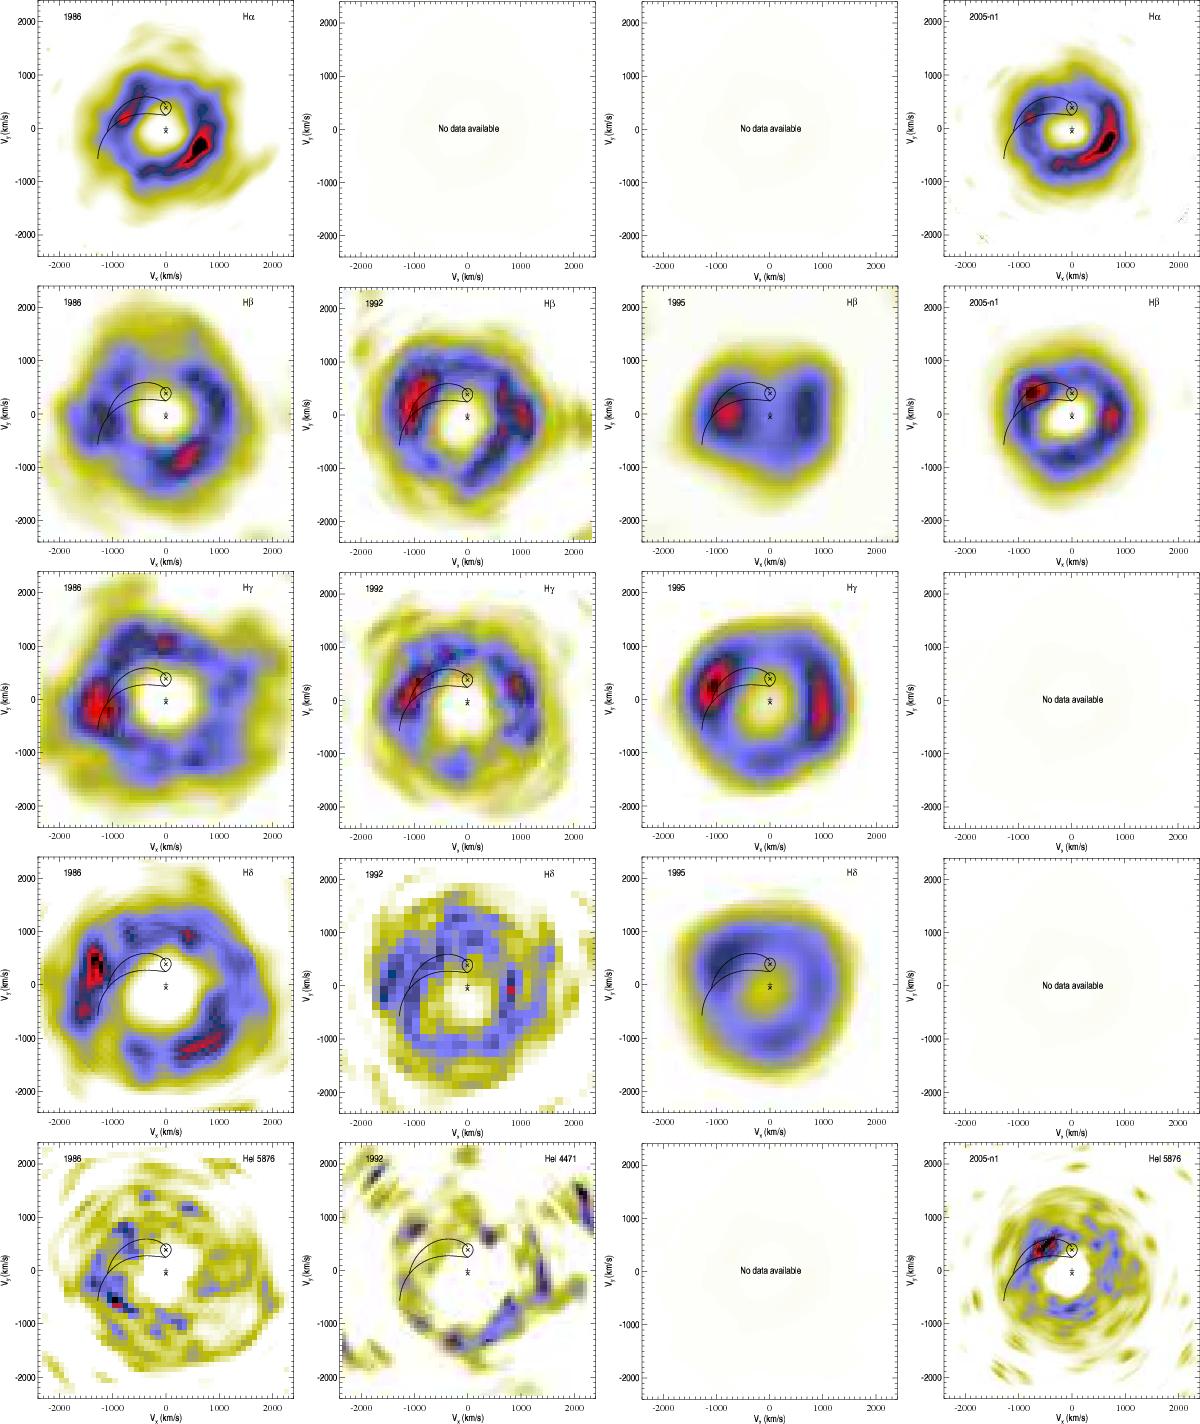
Doppler tomography for the Balmer and He i emission lines. Each column shows the maps for different data sets (1986, 1992, 1995 and 2005-n1). Each row shows the maps for different lines (Hα, Hβ, Hγ, Hδ and He i).
Current usage metrics show cumulative count of Article Views (full-text article views including HTML views, PDF and ePub downloads, according to the available data) and Abstracts Views on Vision4Press platform.
Data correspond to usage on the plateform after 2015. The current usage metrics is available 48-96 hours after online publication and is updated daily on week days.
Initial download of the metrics may take a while.