Fig. 6
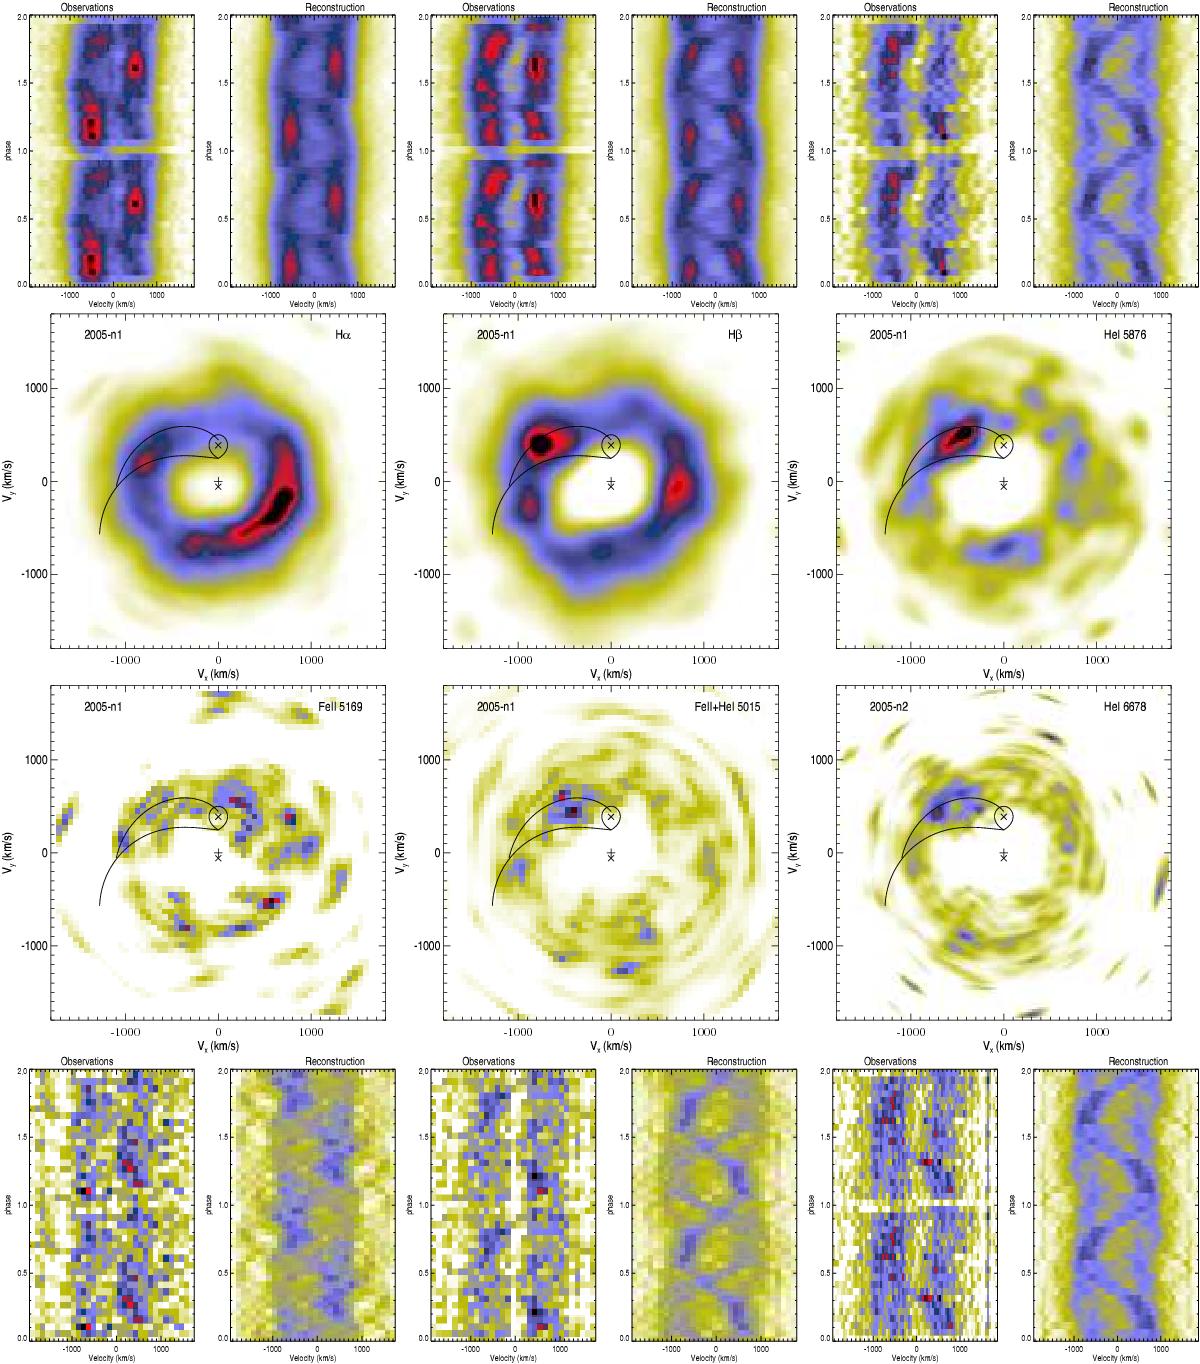
Doppler tomography for the Hα, Hβ, and He i 5876 emission lines (in the upper half of the figure), and for Fe ii 5169, He i 5015, and He i 6678 (in the bottom half of the figure) from the data sets 2005-n1 and 2005-n2. For each line, the Doppler maps (two middle panels) and corresponding observed and reconstructed trailed spectra (top and bottom panels) are shown. Indicated on the maps are the positions of the WD (lower cross), the centre of mass of the binary (middle cross) and the Roche lobe of the secondary star (upper bubble with the cross). The predicted trajectory of the gas stream and the Keplerian velocity of the disc along the gas stream have also been shown in the form of the lower and upper curves, respectively. The Roche lobe of the secondary and the trajectories have been plotted using the system parameters, derived by Horne et al. (1991).
Current usage metrics show cumulative count of Article Views (full-text article views including HTML views, PDF and ePub downloads, according to the available data) and Abstracts Views on Vision4Press platform.
Data correspond to usage on the plateform after 2015. The current usage metrics is available 48-96 hours after online publication and is updated daily on week days.
Initial download of the metrics may take a while.