Free Access
Fig. 4
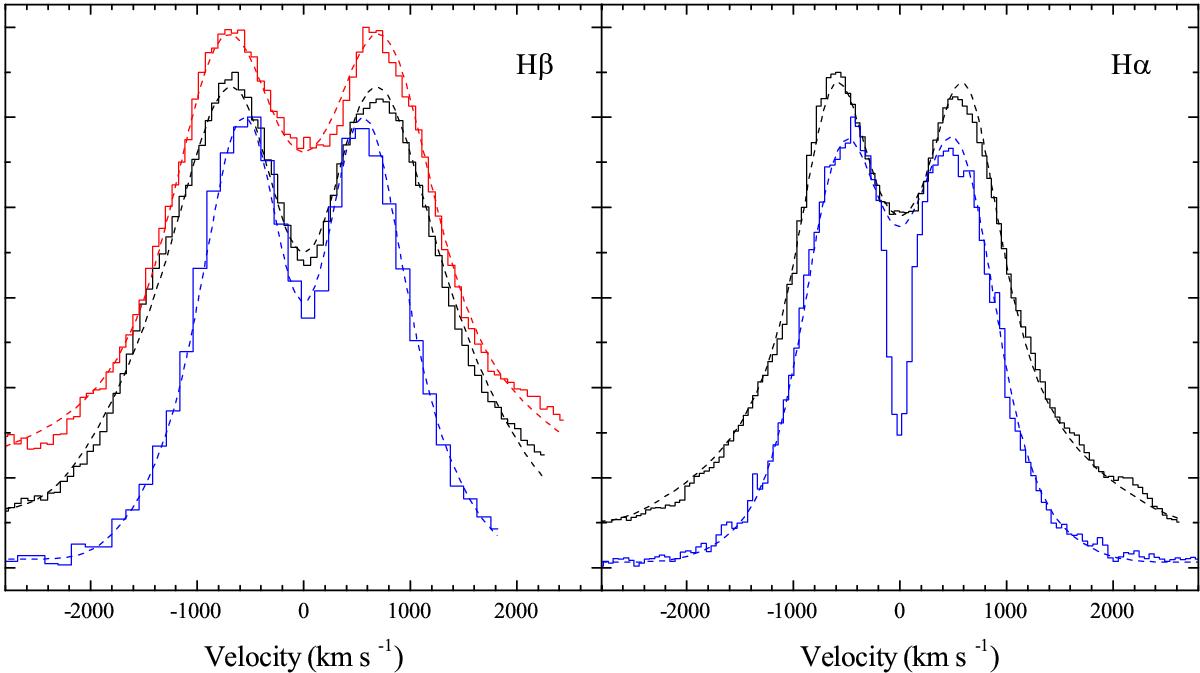
Averaged profiles of the Hα and Hβ emission lines, observed in 1992, 1986, and 2005 (red, black, and blue lines, respectively) together with the corresponding model fits (dashed lines). The 1992, 1986, and 2005 profiles are shifted vertically by 10% to prevent overlap.
Current usage metrics show cumulative count of Article Views (full-text article views including HTML views, PDF and ePub downloads, according to the available data) and Abstracts Views on Vision4Press platform.
Data correspond to usage on the plateform after 2015. The current usage metrics is available 48-96 hours after online publication and is updated daily on week days.
Initial download of the metrics may take a while.