Fig. 12
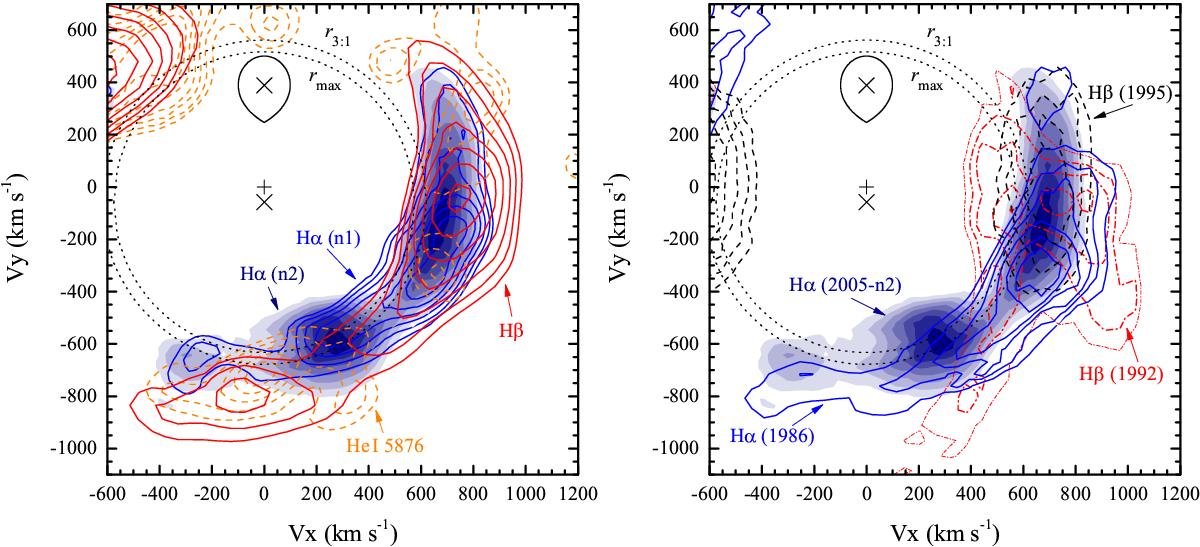
Doppler maps that combine the tomograms for different lines from the 2005 observations (left) and for the strongest lines from different sets of observations (right). The maps are zoomed around the emission region in the leading side of the accretion disc. The circular dashed lines represent Keplerian velocities at the tidal truncation (rmax) and 3:1 resonance (r3:1) radii.
Current usage metrics show cumulative count of Article Views (full-text article views including HTML views, PDF and ePub downloads, according to the available data) and Abstracts Views on Vision4Press platform.
Data correspond to usage on the plateform after 2015. The current usage metrics is available 48-96 hours after online publication and is updated daily on week days.
Initial download of the metrics may take a while.