Fig. 11
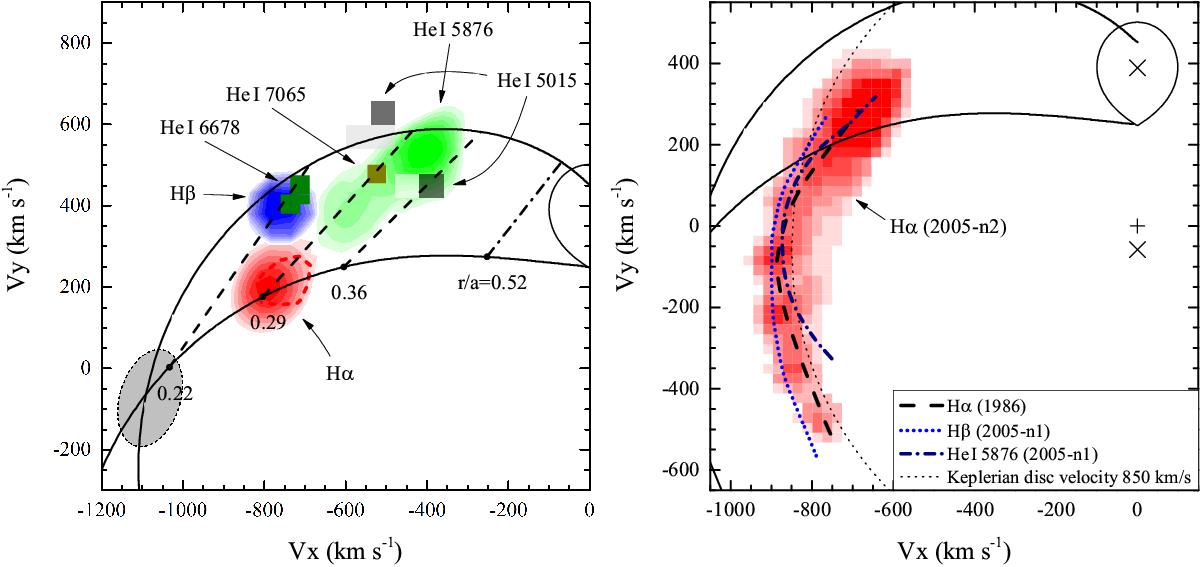
Left: zoomed hotspot area of the Doppler map combined from all the tomograms taken during the 2005 observations, with different contrasts to emphasise the hotspot location. The map also shows the spot location from the 1986 observations. The Hα spot is marked by the red dashed line. A grey oval shows the other spectral lines. The dashed lines connect the velocity of the ballistic gas stream (lower curve) and the velocity on the Keplerian disc along the gas stream (upper curve) for the same points at distances labelled along the lower curve (in r/a units). The dash-dotted line corresponds to the measured radius of the accretion disc, which coincides with the tidal truncation radius rmax/a = 0.52. Right: zoomed part of the Hα Doppler map from the set-2005-n2 centred around the spiral arm area. The thick lines show the trace of this area in other spectral lines and data sets. Dotted thin line shows the Keplerian disc velocity of 850 km s-1.

Current usage metrics show cumulative count of Article Views (full-text article views including HTML views, PDF and ePub downloads, according to the available data) and Abstracts Views on Vision4Press platform.
Data correspond to usage on the plateform after 2015. The current usage metrics is available 48-96 hours after online publication and is updated daily on week days.
Initial download of the metrics may take a while.