Fig. 10
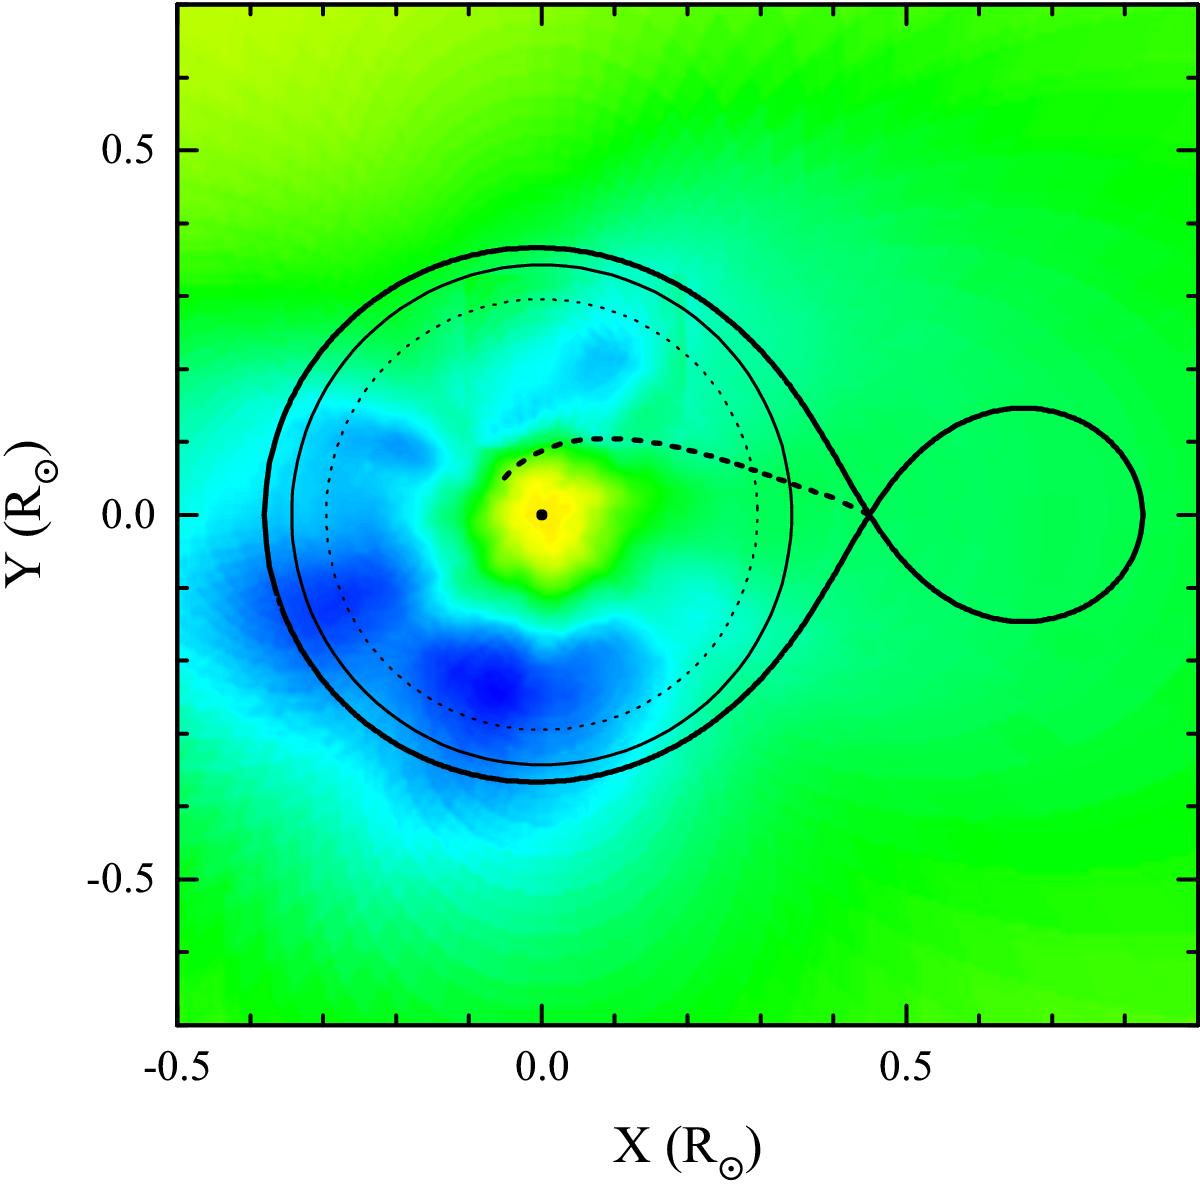
Hα Doppler map from the 2005 observations transformed to a spatial image, assuming a circular Keplerian flow in the disc. The Roche lobes of the stars (thick solid line), the tidal truncation (thin solid line), and 3:1 resonance (thin dashed line) radii are also shown. The thick dashed line represents the gas stream from the donor star.
Current usage metrics show cumulative count of Article Views (full-text article views including HTML views, PDF and ePub downloads, according to the available data) and Abstracts Views on Vision4Press platform.
Data correspond to usage on the plateform after 2015. The current usage metrics is available 48-96 hours after online publication and is updated daily on week days.
Initial download of the metrics may take a while.