Free Access
Fig. 5
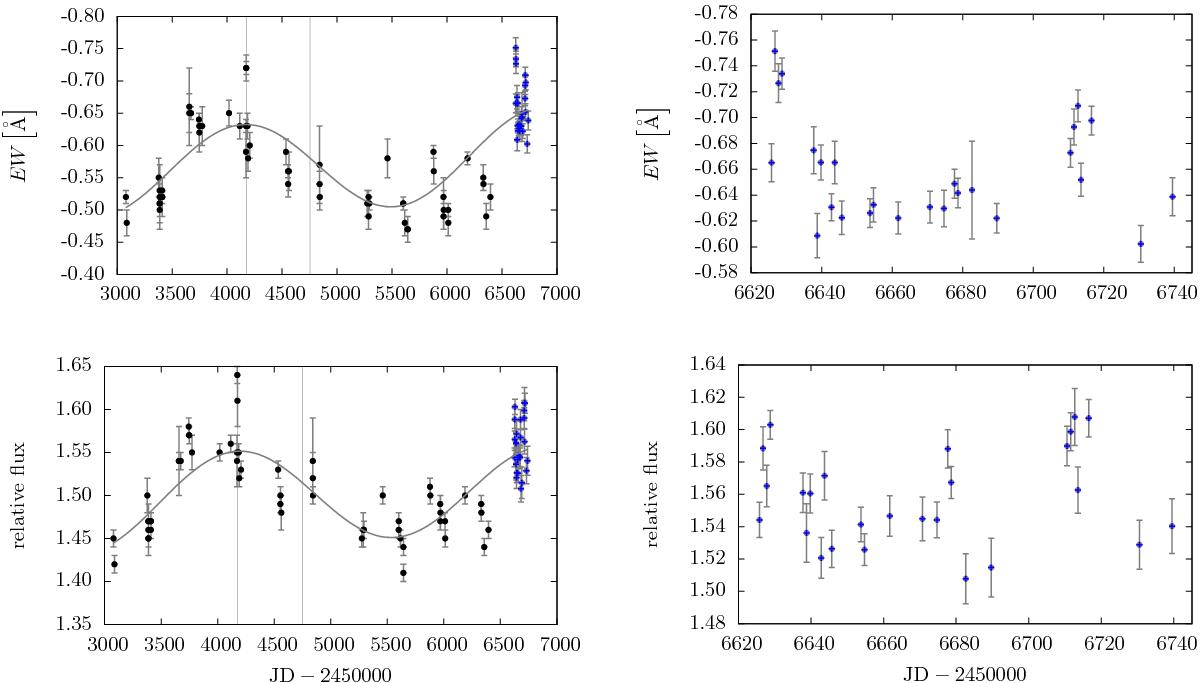
EW and relative flux of the [O i] 6300 Å line. The plotted curve is a fit of two sine functions with fixed periods found by the period analysis of the Hα EW.
Current usage metrics show cumulative count of Article Views (full-text article views including HTML views, PDF and ePub downloads, according to the available data) and Abstracts Views on Vision4Press platform.
Data correspond to usage on the plateform after 2015. The current usage metrics is available 48-96 hours after online publication and is updated daily on week days.
Initial download of the metrics may take a while.