Fig. 3
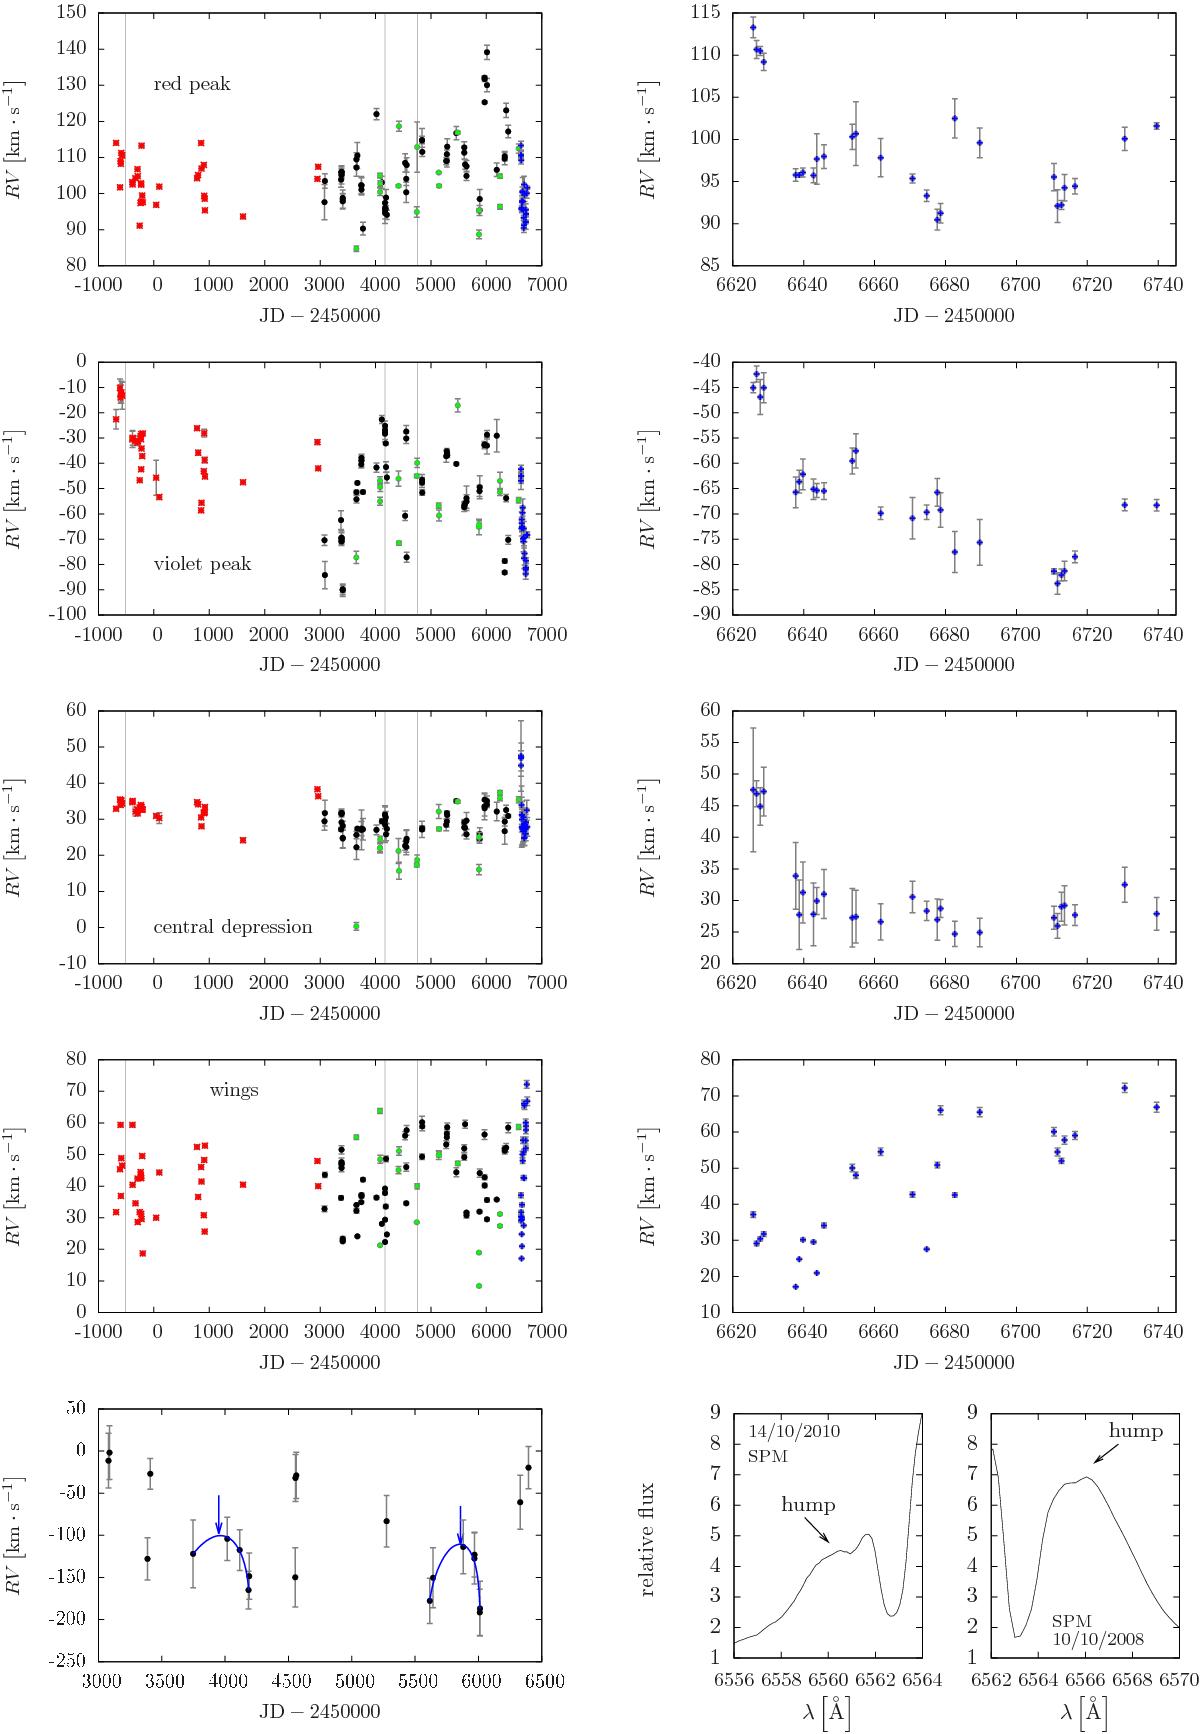
RVs of the Hα features. The right panels show observations obtained at TCO during the last season in detail. RVs of the red peak, the violet peak, the central depression, wing, and humps are shown from top to bottom. Parabolic fits to the RV variations of the humps detected during two seasons are shown by the solid lines with arrows. The vertical lines indicate the same epochs as in Fig. 2.
Current usage metrics show cumulative count of Article Views (full-text article views including HTML views, PDF and ePub downloads, according to the available data) and Abstracts Views on Vision4Press platform.
Data correspond to usage on the plateform after 2015. The current usage metrics is available 48-96 hours after online publication and is updated daily on week days.
Initial download of the metrics may take a while.