Fig. A.14
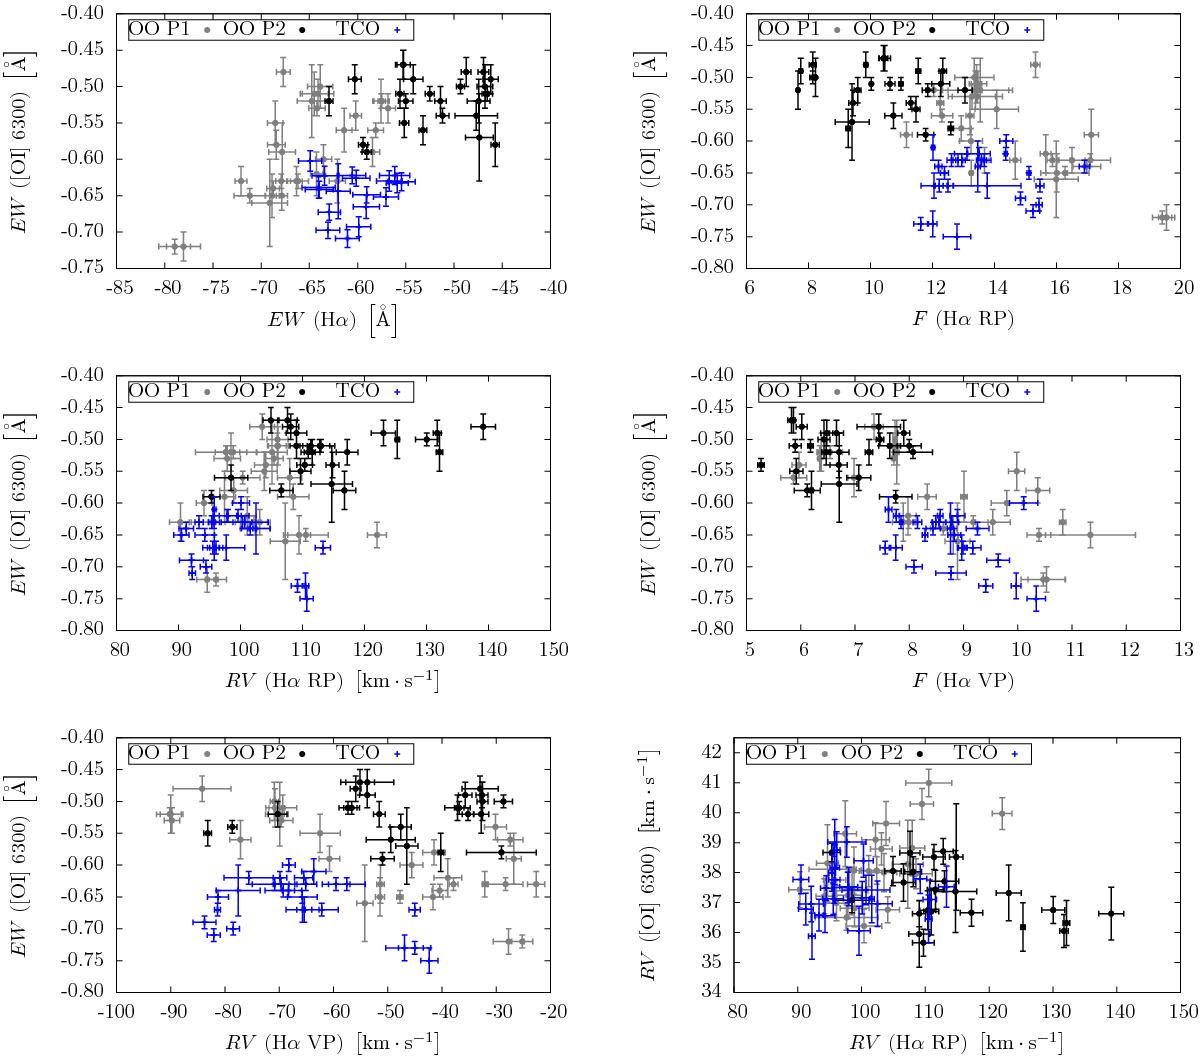
Correlation diagram of Hα and [O i] λ 6300 Å lines. Dots consistently denote the measurements of spectra from Ondřejov observatory and crosses from TCO observatory throughout the paper. The values before the event, when V/R > 1, are in black. Blue indicates the value after another maximum in V/R changes. The epoch between is in grey. To emphasise that the same epochs are also defined by the RVs of the central depression, the error bars are coloured according to the RV extrema. The black, grey, and blue are used chronologically.
Current usage metrics show cumulative count of Article Views (full-text article views including HTML views, PDF and ePub downloads, according to the available data) and Abstracts Views on Vision4Press platform.
Data correspond to usage on the plateform after 2015. The current usage metrics is available 48-96 hours after online publication and is updated daily on week days.
Initial download of the metrics may take a while.