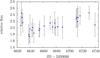
Fig. A.6
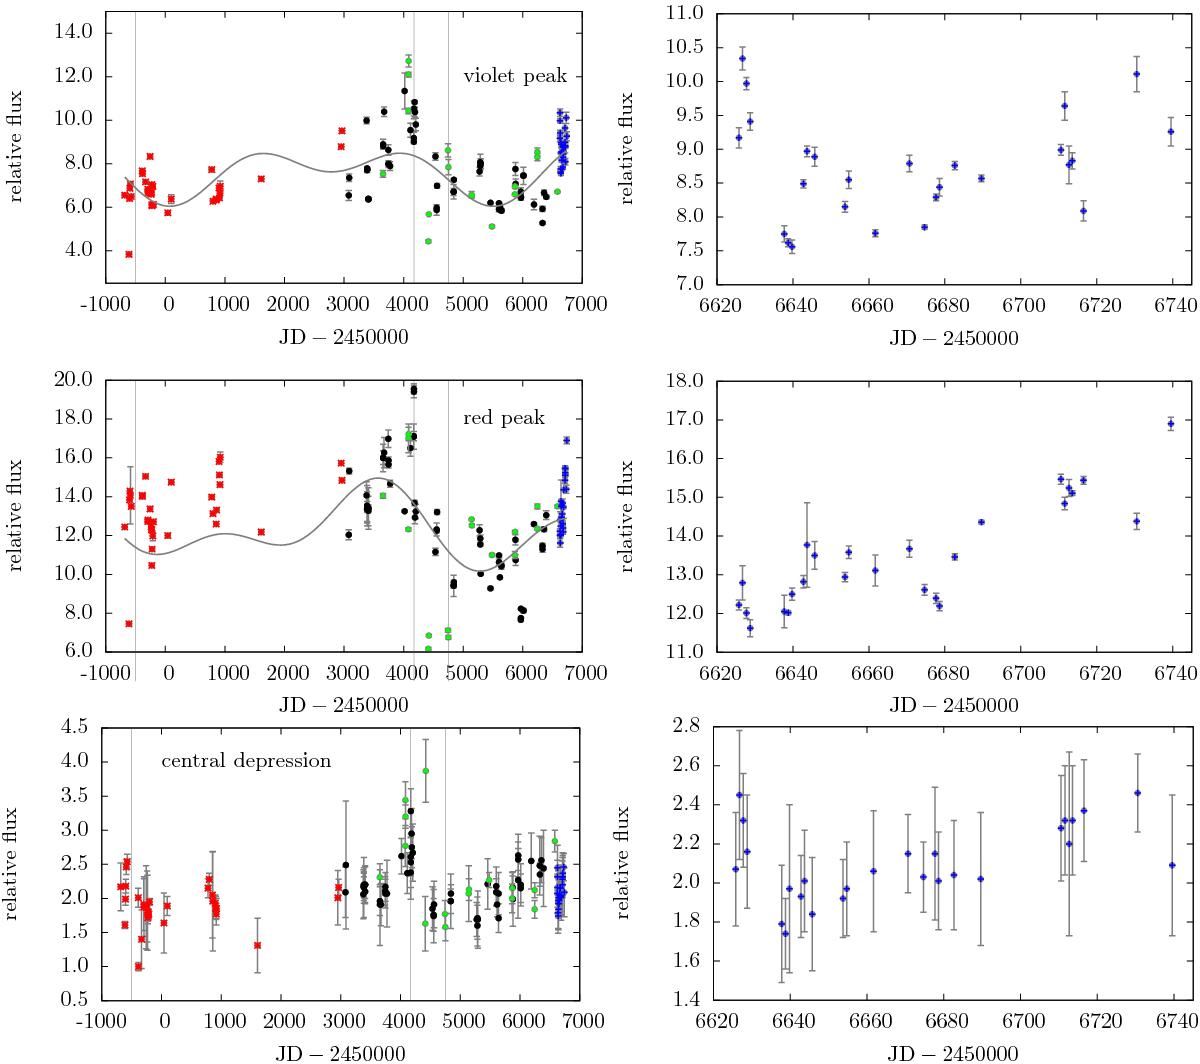
Relative fluxes of violet and red peak (upper) and of the central depression of the Hα line. The minimum and maximum value of | EW | of the Hα line and its V/R> 1 are shown by the vertical lines. The curve at two upper graphs is a fit of linear combinations of two sine functions with the fixed periods obtained from the period analysis of the Hα EWs.
Current usage metrics show cumulative count of Article Views (full-text article views including HTML views, PDF and ePub downloads, according to the available data) and Abstracts Views on Vision4Press platform.
Data correspond to usage on the plateform after 2015. The current usage metrics is available 48-96 hours after online publication and is updated daily on week days.
Initial download of the metrics may take a while.