Free Access
Fig. A.5
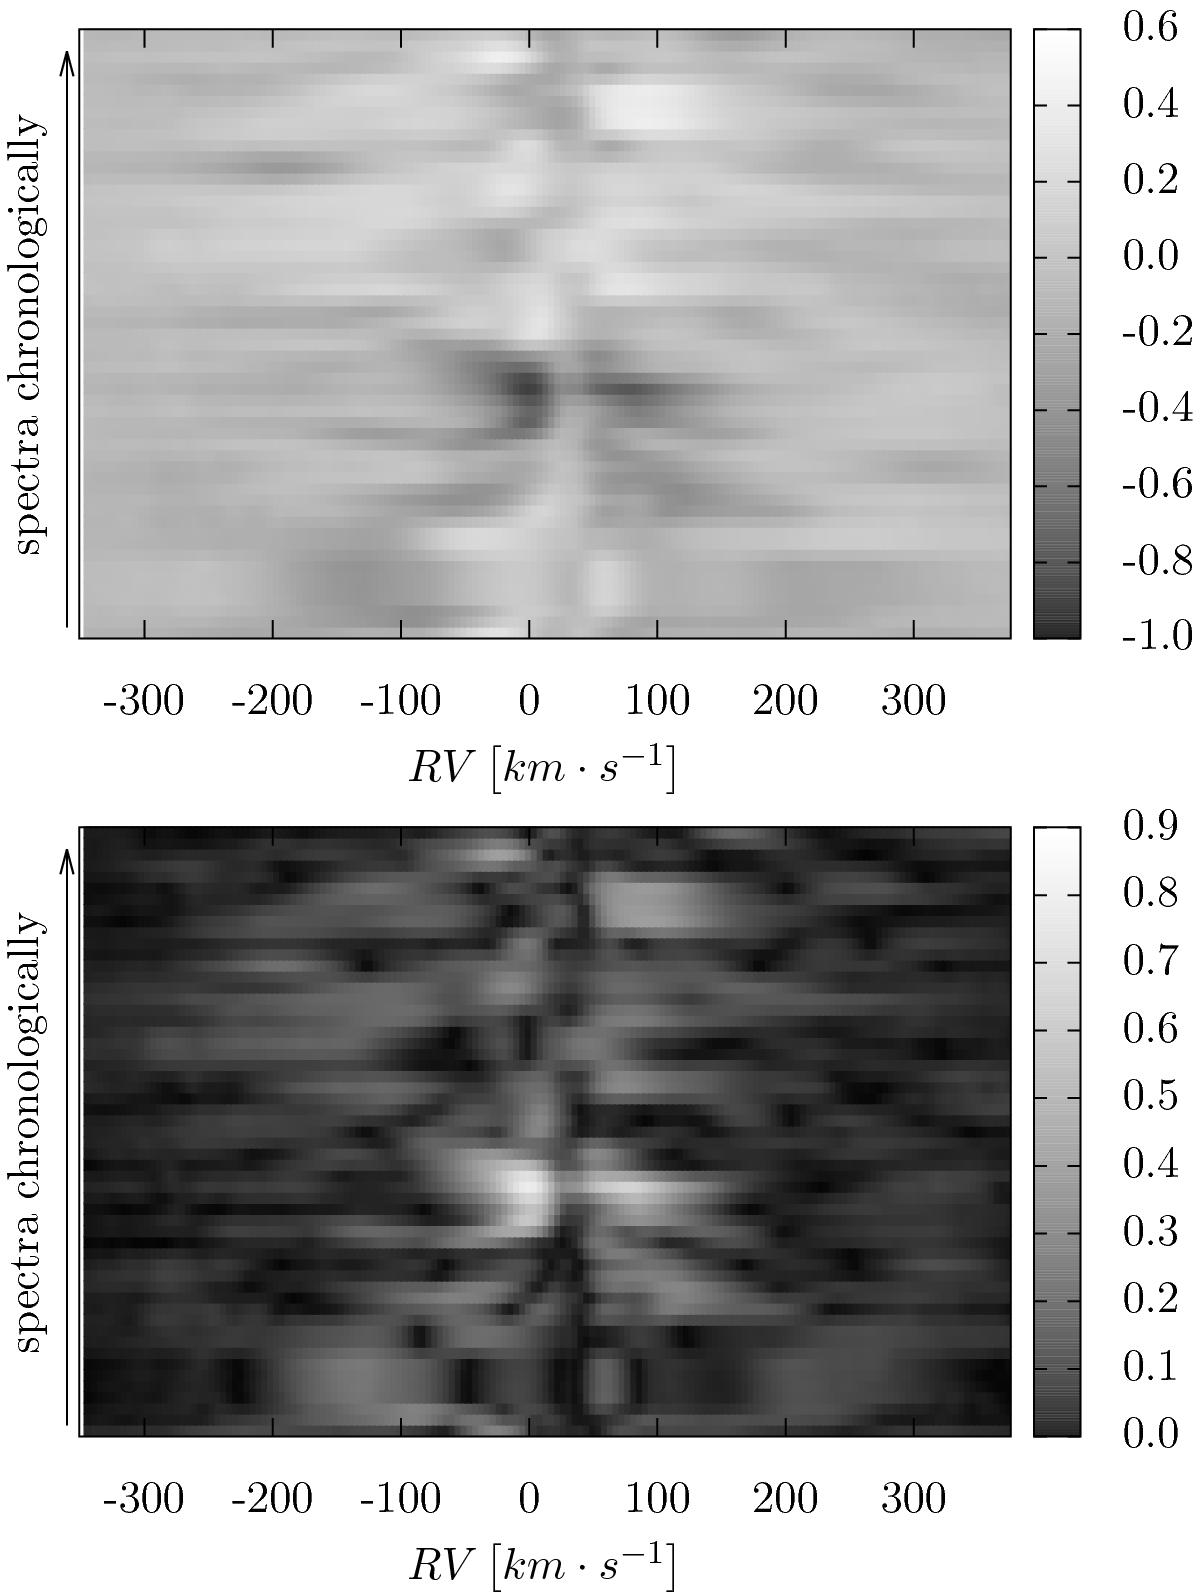
Grey-scale representation of the Hα line on the spectra from OO. The residuals between the given line profile and averaged line profile (upper panel). To emphasise the structures, the absolute value of the differences is plotted on the lower panel.
This figure is made of several images, please see below:
Current usage metrics show cumulative count of Article Views (full-text article views including HTML views, PDF and ePub downloads, according to the available data) and Abstracts Views on Vision4Press platform.
Data correspond to usage on the plateform after 2015. The current usage metrics is available 48-96 hours after online publication and is updated daily on week days.
Initial download of the metrics may take a while.