Fig. A.1
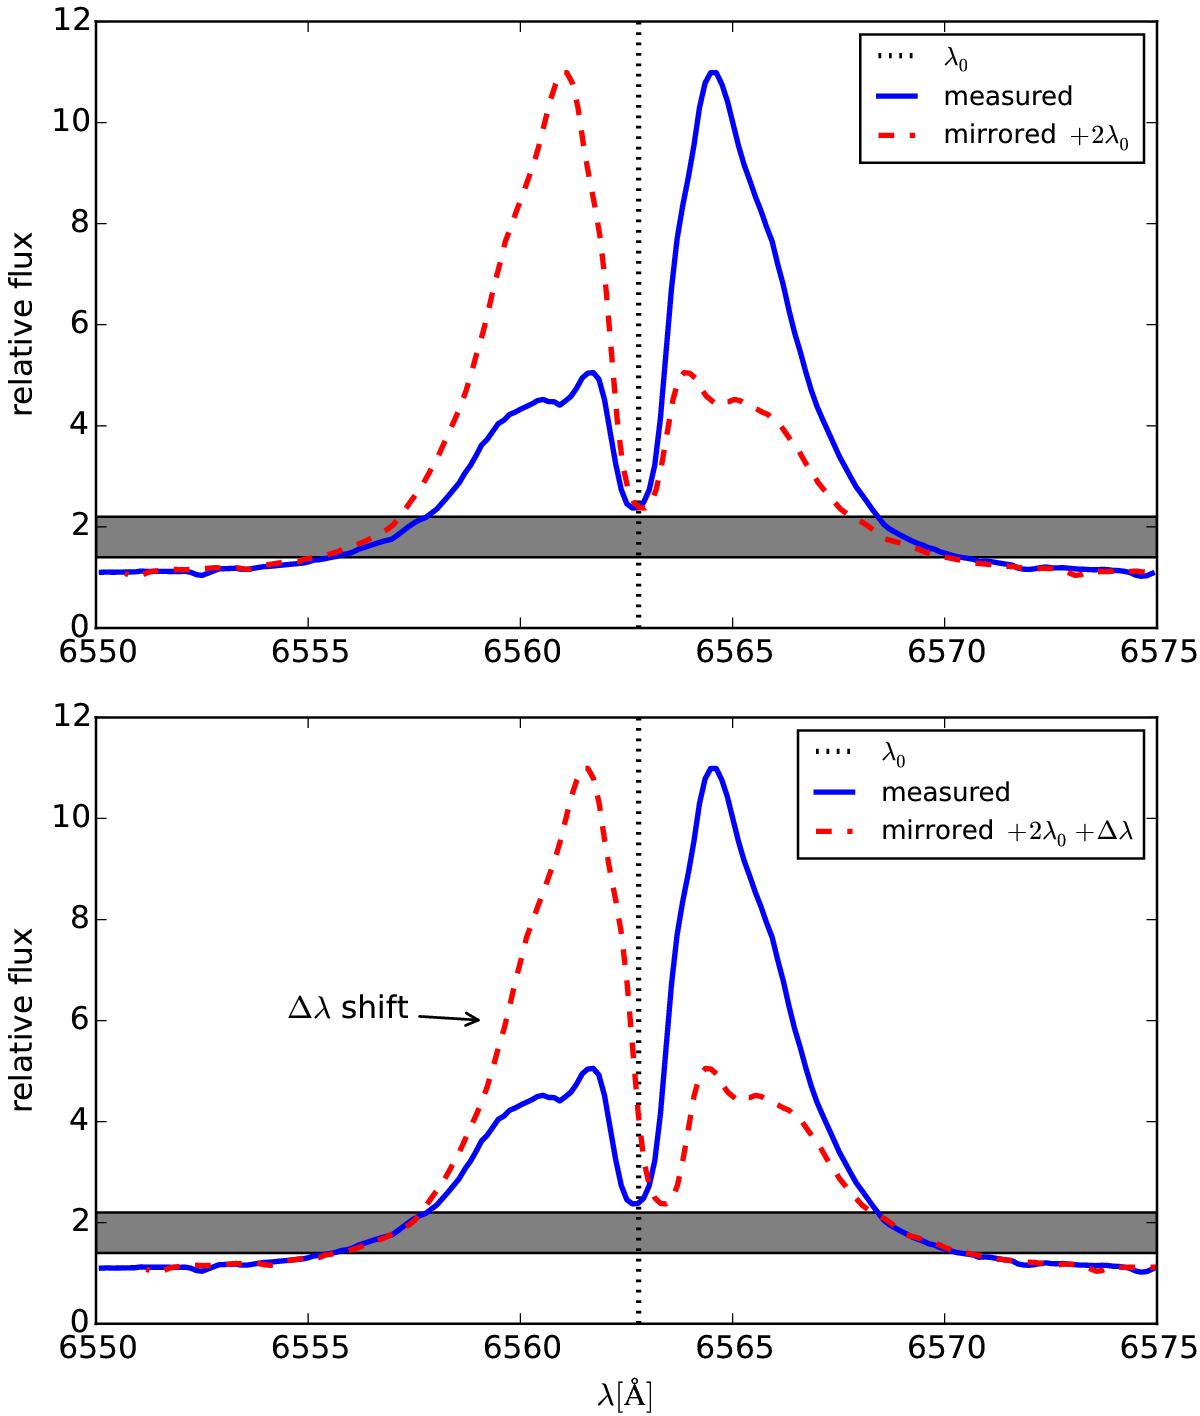
Demonstration of the RV measurements using the line-profile mirroring. The best agreement of the original (blue solid line) and flipped spectra (red dashed line) is obtained by the least squares method. The grey belt defines the interval of the relative flux where the RV are measured. The plotted spectrum is from 14 October 2010 (SPM).
Current usage metrics show cumulative count of Article Views (full-text article views including HTML views, PDF and ePub downloads, according to the available data) and Abstracts Views on Vision4Press platform.
Data correspond to usage on the plateform after 2015. The current usage metrics is available 48-96 hours after online publication and is updated daily on week days.
Initial download of the metrics may take a while.