Fig. 10
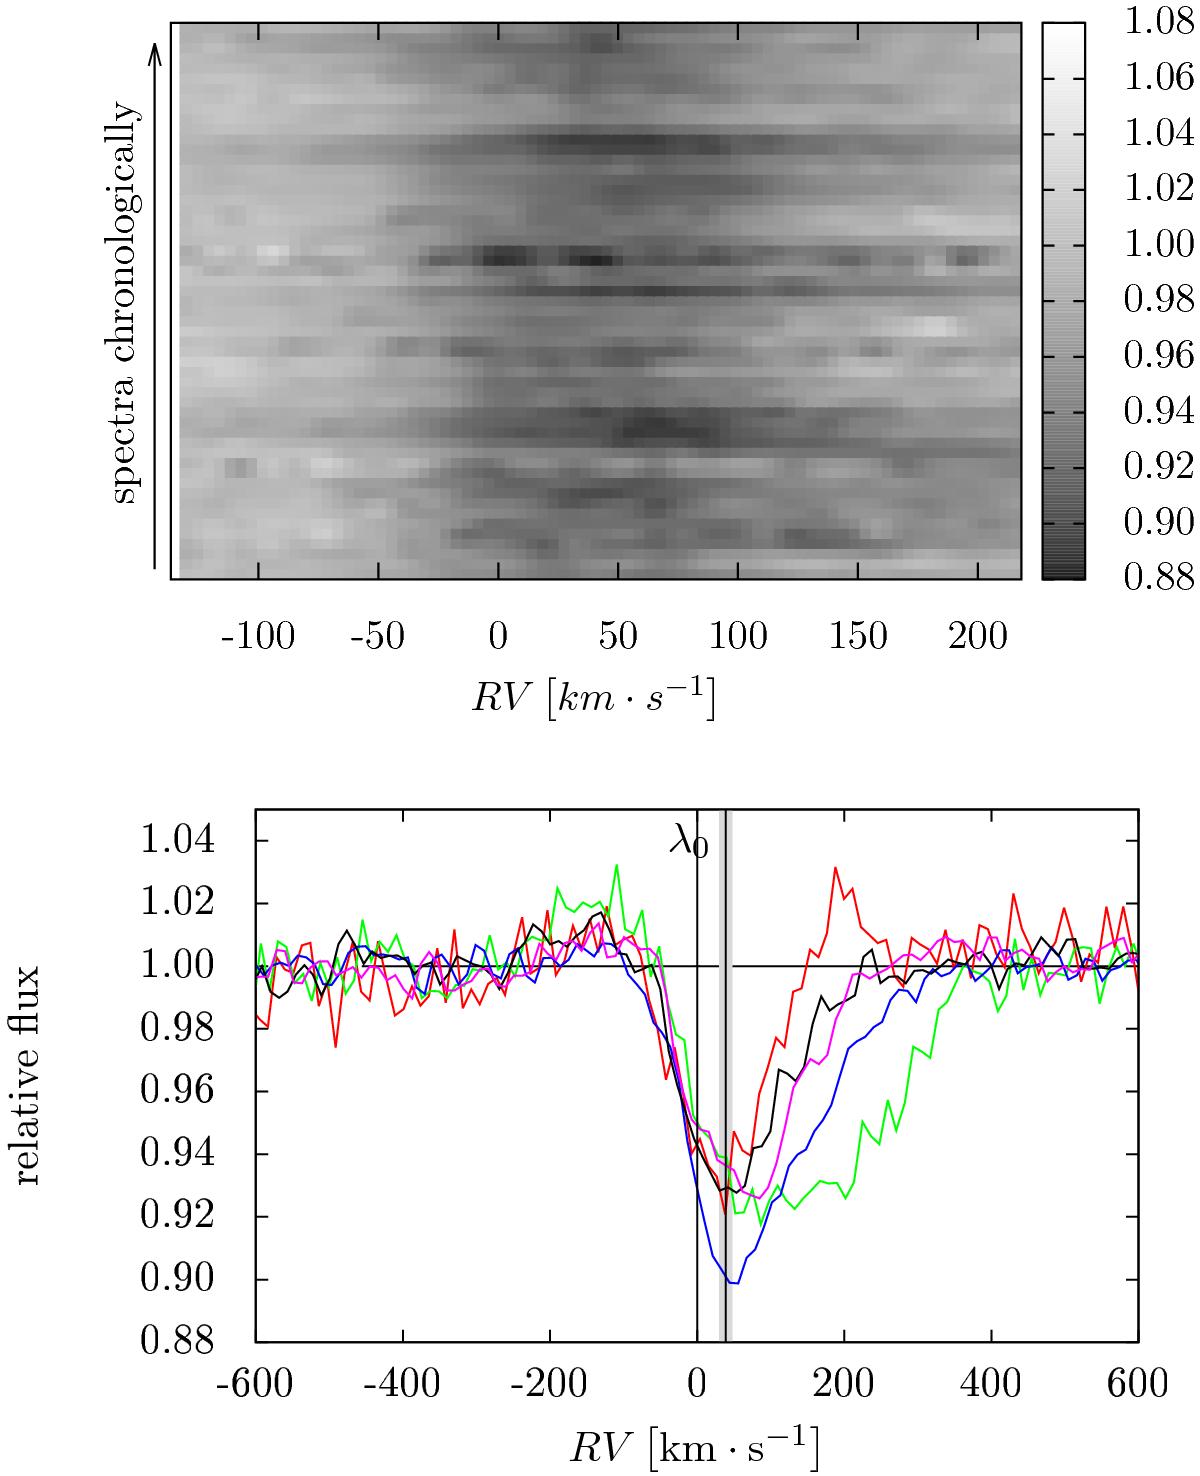
Variations of He i 6678 Å line. Upper panel: grey-scale representation. Bottom panel: the typical line profiles are plotted from the spectra taken at the Ondřejov Observatory (R ~ 12 500). The central wavelength is denoted in the laboratory frame λ0 and in the frame connected with the object. The shift is determined by the system RV rvsys = 40 ± 4 km s-1 obtained from the RVs of the [O i] λλ 6300, 6364 Å lines.
Current usage metrics show cumulative count of Article Views (full-text article views including HTML views, PDF and ePub downloads, according to the available data) and Abstracts Views on Vision4Press platform.
Data correspond to usage on the plateform after 2015. The current usage metrics is available 48-96 hours after online publication and is updated daily on week days.
Initial download of the metrics may take a while.