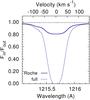
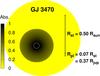
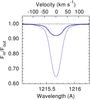
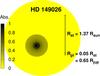
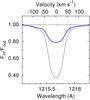
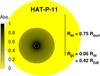
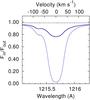
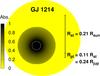
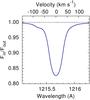
Fig. A.2

Simulated Lyα transmission for low-potential planets. For each system we show the absorption in the Lyα line from below the Roche lobe (solid line) and from unbound hydrogen (dashed, blue). Black dashed lines indicate the optical transit depth. Calculated transmission images are depicted next to each spectrum. The mass-loss rate decreases from top to bottom.

Current usage metrics show cumulative count of Article Views (full-text article views including HTML views, PDF and ePub downloads, according to the available data) and Abstracts Views on Vision4Press platform.
Data correspond to usage on the plateform after 2015. The current usage metrics is available 48-96 hours after online publication and is updated daily on week days.
Initial download of the metrics may take a while.