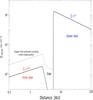
Fig. 7
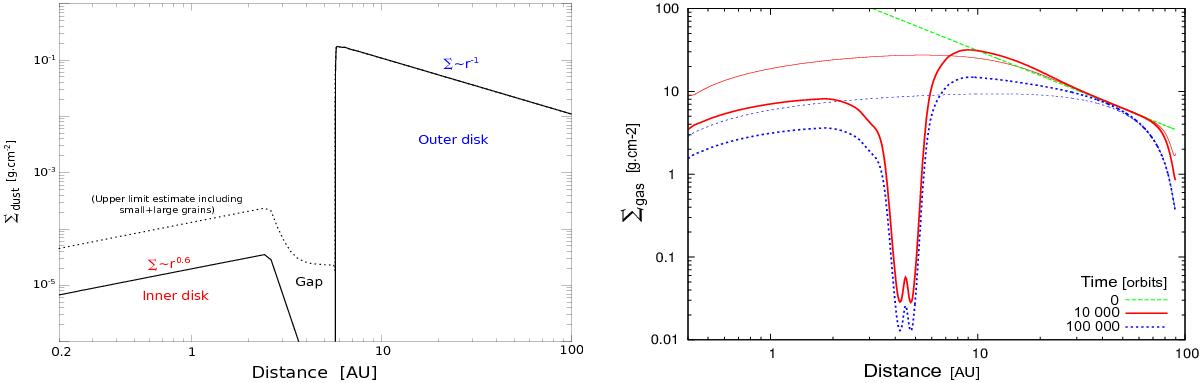
Left: dust surface density profile of the best-fit radiative transfer model as a function of the distance to the star. The upper limit on the dust surface density (small + large grains) in the inner disk and the gap is overplotted (dotted line). Right: azimuthally averaged gas surface density profiles at various times in a gaseous disk perturbed by a 3.4 MJup planet. The green line is the initial gas surface density profile; the two thinner and faded solid lines represent the gas surface density profiles after 10 000 (~105 yrs) and 100 000 orbits (~1 Myr), without including the planet.
Current usage metrics show cumulative count of Article Views (full-text article views including HTML views, PDF and ePub downloads, according to the available data) and Abstracts Views on Vision4Press platform.
Data correspond to usage on the plateform after 2015. The current usage metrics is available 48-96 hours after online publication and is updated daily on week days.
Initial download of the metrics may take a while.