Free Access
Fig. 2
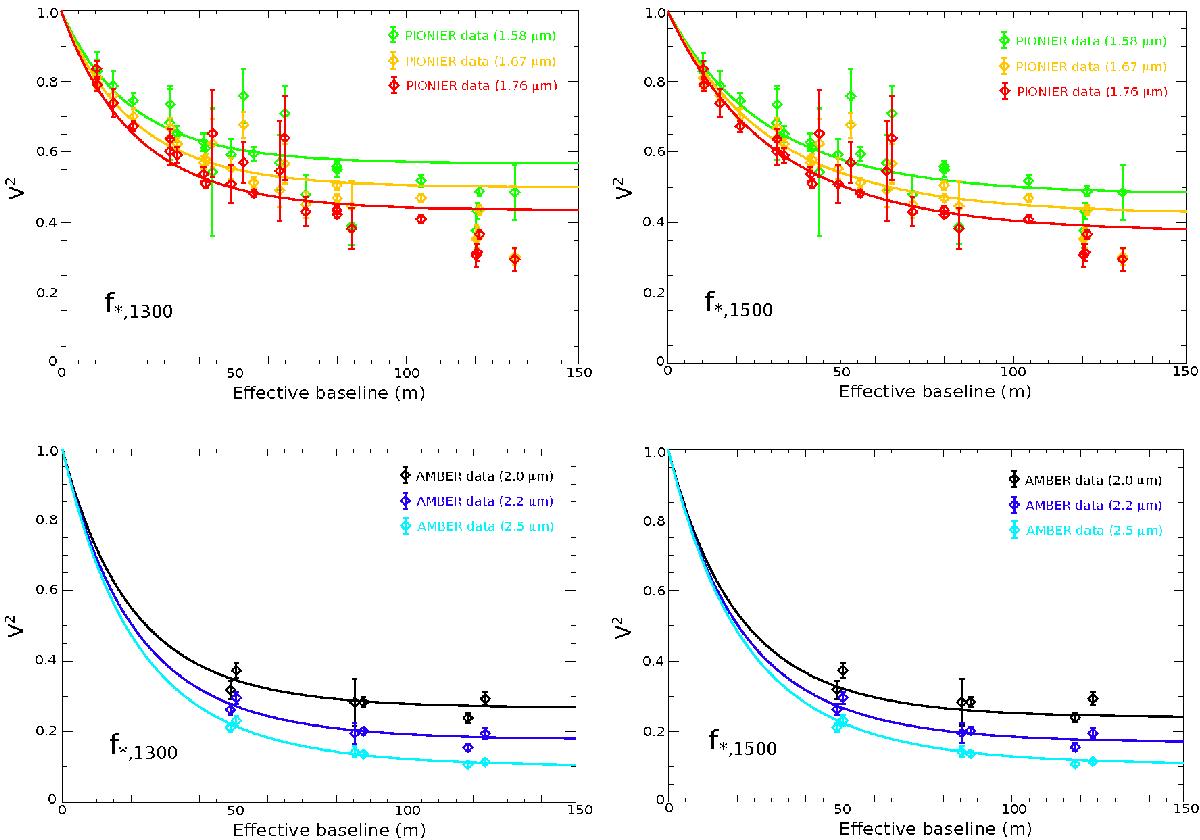
Best-fit Lorentzian model (solid line) for PIONIER and AMBER overplotted on their measured V2, as a function of the effective baseline (see Eq. (1)). For clarity, we only plot the AMBER V2 at λ = 2.0μm, 2.2 μm, and 2.5 μm.
Current usage metrics show cumulative count of Article Views (full-text article views including HTML views, PDF and ePub downloads, according to the available data) and Abstracts Views on Vision4Press platform.
Data correspond to usage on the plateform after 2015. The current usage metrics is available 48-96 hours after online publication and is updated daily on week days.
Initial download of the metrics may take a while.