Free Access
Fig. A.2
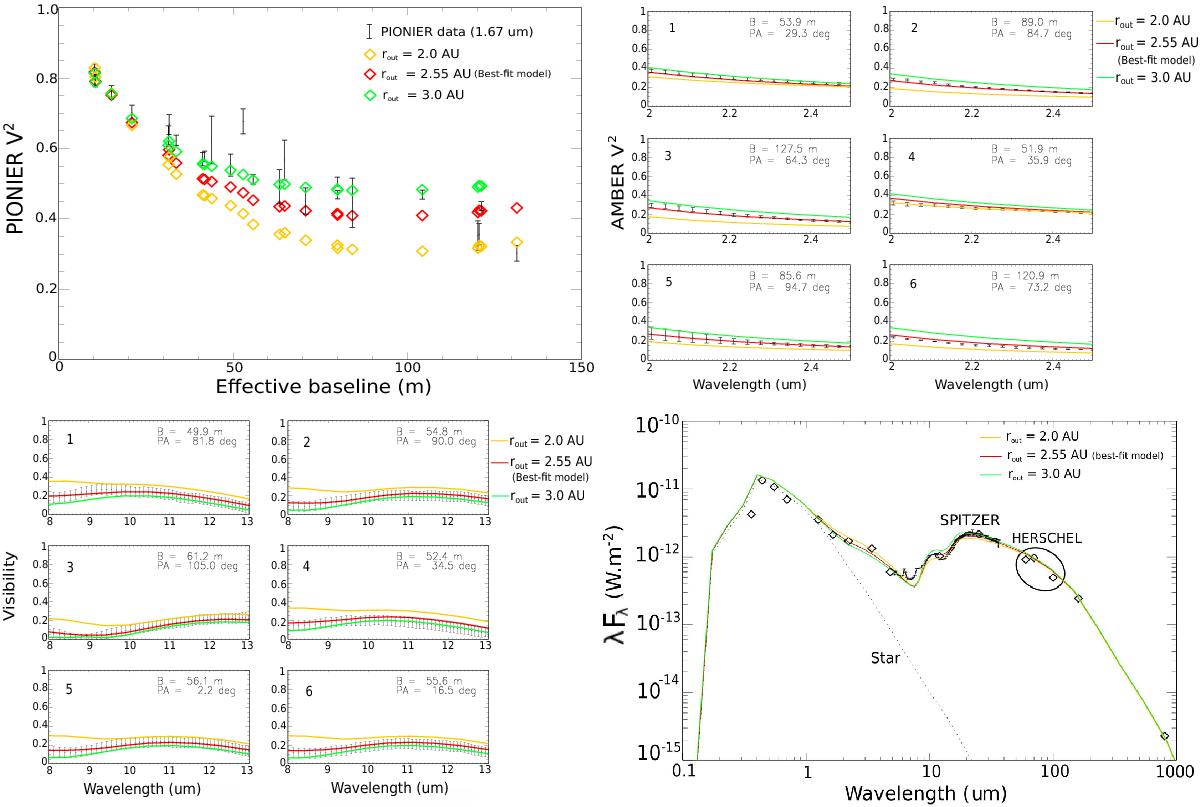
Same as in Fig. A.1 but focusing on the effect on a change in the outer radius of the inner disk rout. We also included the modeled N-band visibilities, overplotted on the measured MIDI visibilities (bottom left).
Current usage metrics show cumulative count of Article Views (full-text article views including HTML views, PDF and ePub downloads, according to the available data) and Abstracts Views on Vision4Press platform.
Data correspond to usage on the plateform after 2015. The current usage metrics is available 48-96 hours after online publication and is updated daily on week days.
Initial download of the metrics may take a while.