Fig. 7
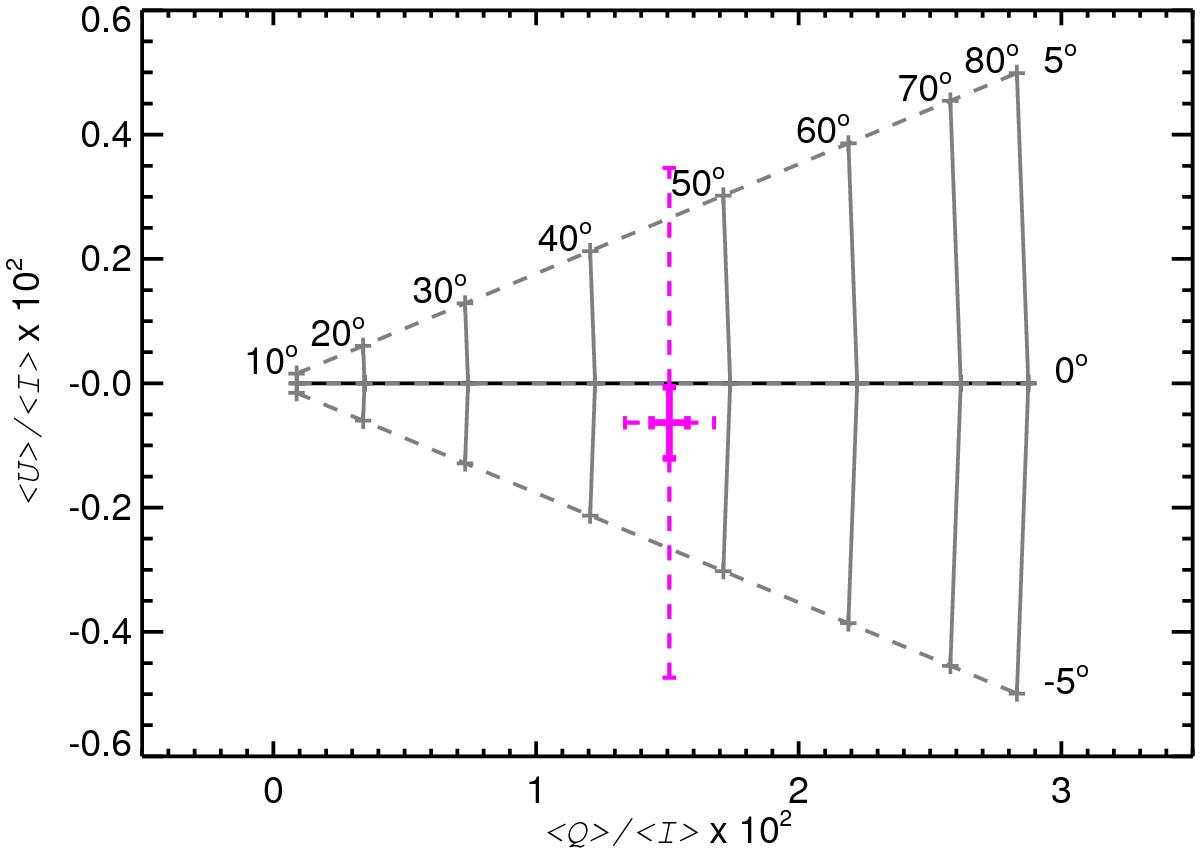
Comparison between the Planck observations and the model. The ratios ⟨ Q ⟩/⟨ I ⟩ and ⟨ U ⟩/⟨ I ⟩ derived from the polarization data are given by the magenta point. The statistical and systematic uncertainties are shown by the solid and dashed error bars, respectively. The dashed grey lines show the solutions for φ0 = −5°, 0°, and 5°, with θ0 varying from 10° to 80°. The solid grey lines indicate how the ratios change with φ0, for a given θ0 angle. The model results are calculated here for p0 = 4%.
Current usage metrics show cumulative count of Article Views (full-text article views including HTML views, PDF and ePub downloads, according to the available data) and Abstracts Views on Vision4Press platform.
Data correspond to usage on the plateform after 2015. The current usage metrics is available 48-96 hours after online publication and is updated daily on week days.
Initial download of the metrics may take a while.