Fig. 5
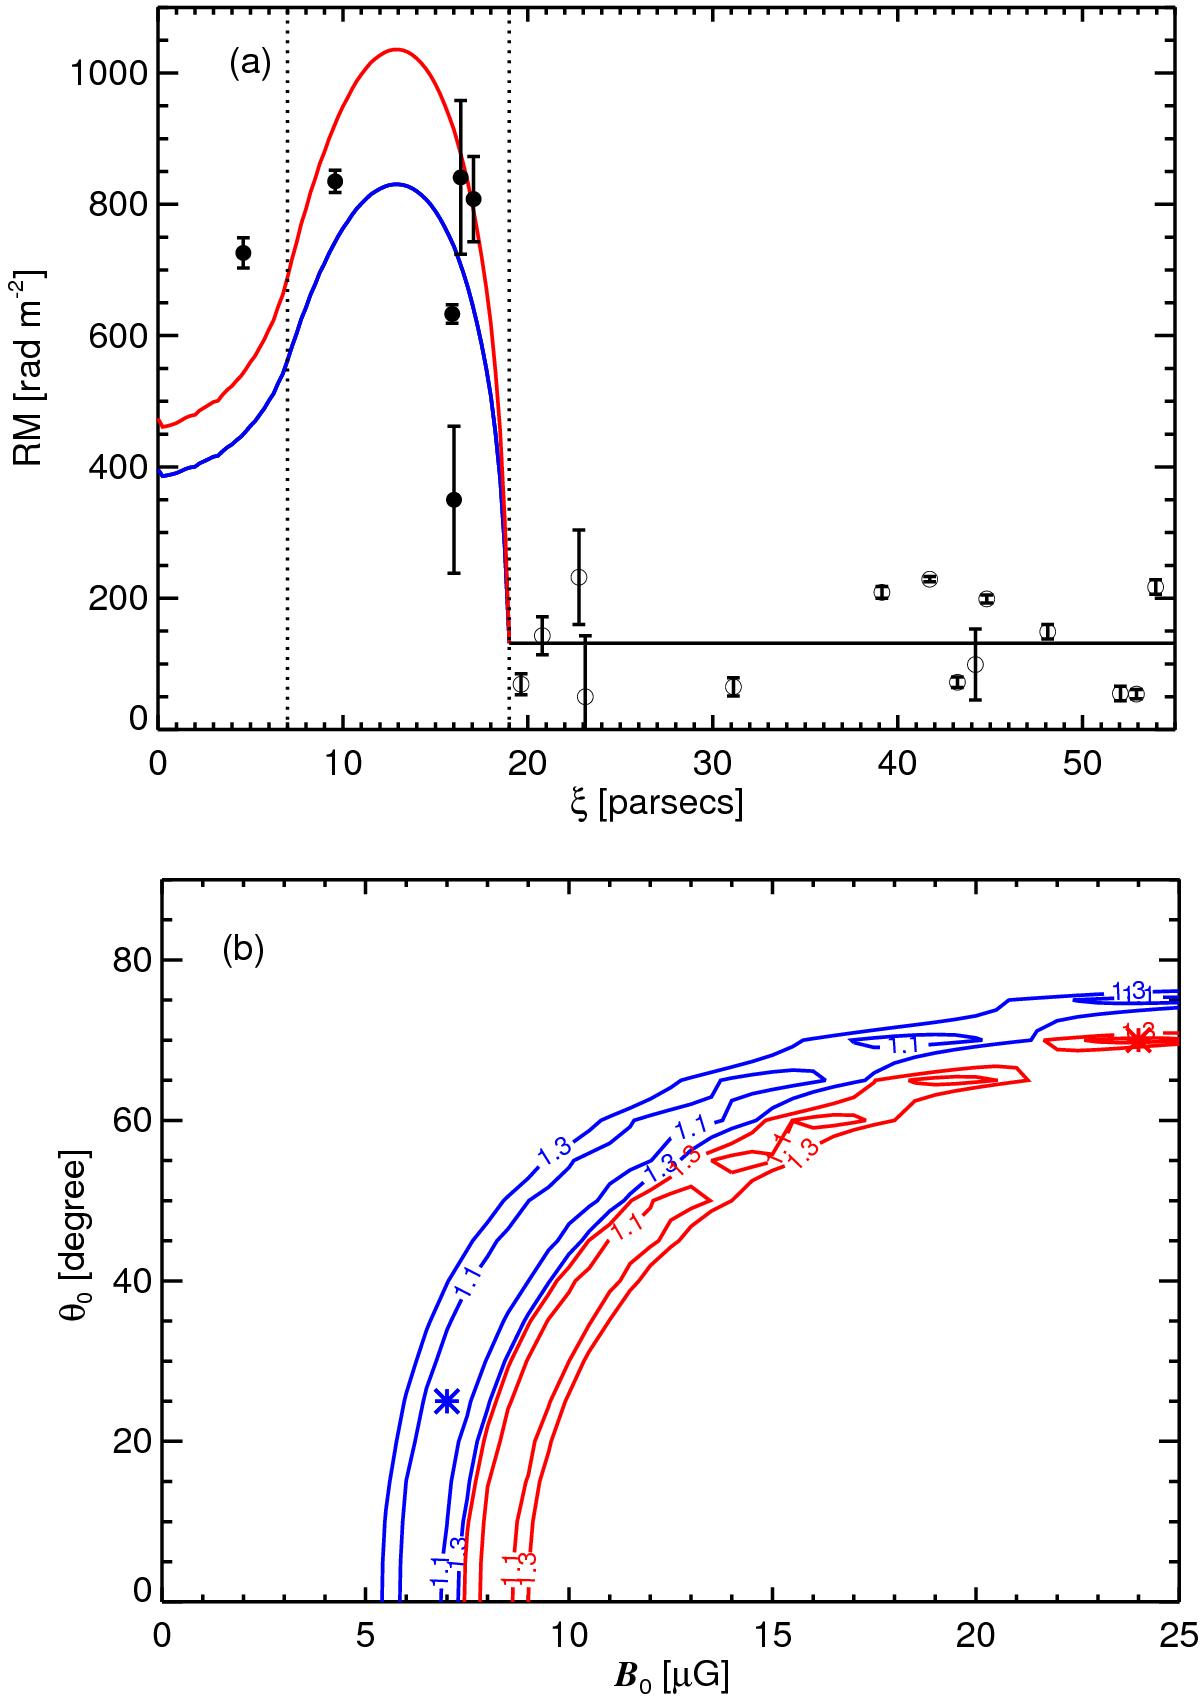
Comparison between the RM observations and the predictions from the model. Panel a) shows the RM data as a function of the distance to the centre of the Rosette. The two vertical dashed lines show the inner and outer radii of the nebula, ![]() pc and
pc and ![]() pc, respectively (Sect. 4.2.2). The blue curve shows the radial profile of the modelled RM for the best fit to the six RM measurements within
pc, respectively (Sect. 4.2.2). The blue curve shows the radial profile of the modelled RM for the best fit to the six RM measurements within ![]() (filled circles), the reference fit. The red curve is the result of fitting the highest four RM data points. The open circles correspond to the RM observations outside the Rosette, used to estimate the background RM, and are not included in the fit. Panel b) presents the reduced χ2 from both fits. The stars indicate the best fit parameters B0 and θ0, which correspond to the minimum
(filled circles), the reference fit. The red curve is the result of fitting the highest four RM data points. The open circles correspond to the RM observations outside the Rosette, used to estimate the background RM, and are not included in the fit. Panel b) presents the reduced χ2 from both fits. The stars indicate the best fit parameters B0 and θ0, which correspond to the minimum ![]() for each fit. The reference fit (blue) gives B0 = 7 μG and θ0 = 25° for χ2 = 271 and Ndof = 4. The second fit (red) gives B0 = 24 μG and θ0 = 70° for χ2 = 76 and Ndof = 2. The contours are at 10 and 30% above the corresponding minimum values of
for each fit. The reference fit (blue) gives B0 = 7 μG and θ0 = 25° for χ2 = 271 and Ndof = 4. The second fit (red) gives B0 = 24 μG and θ0 = 70° for χ2 = 76 and Ndof = 2. The contours are at 10 and 30% above the corresponding minimum values of ![]() .
.
Current usage metrics show cumulative count of Article Views (full-text article views including HTML views, PDF and ePub downloads, according to the available data) and Abstracts Views on Vision4Press platform.
Data correspond to usage on the plateform after 2015. The current usage metrics is available 48-96 hours after online publication and is updated daily on week days.
Initial download of the metrics may take a while.