Fig. 3
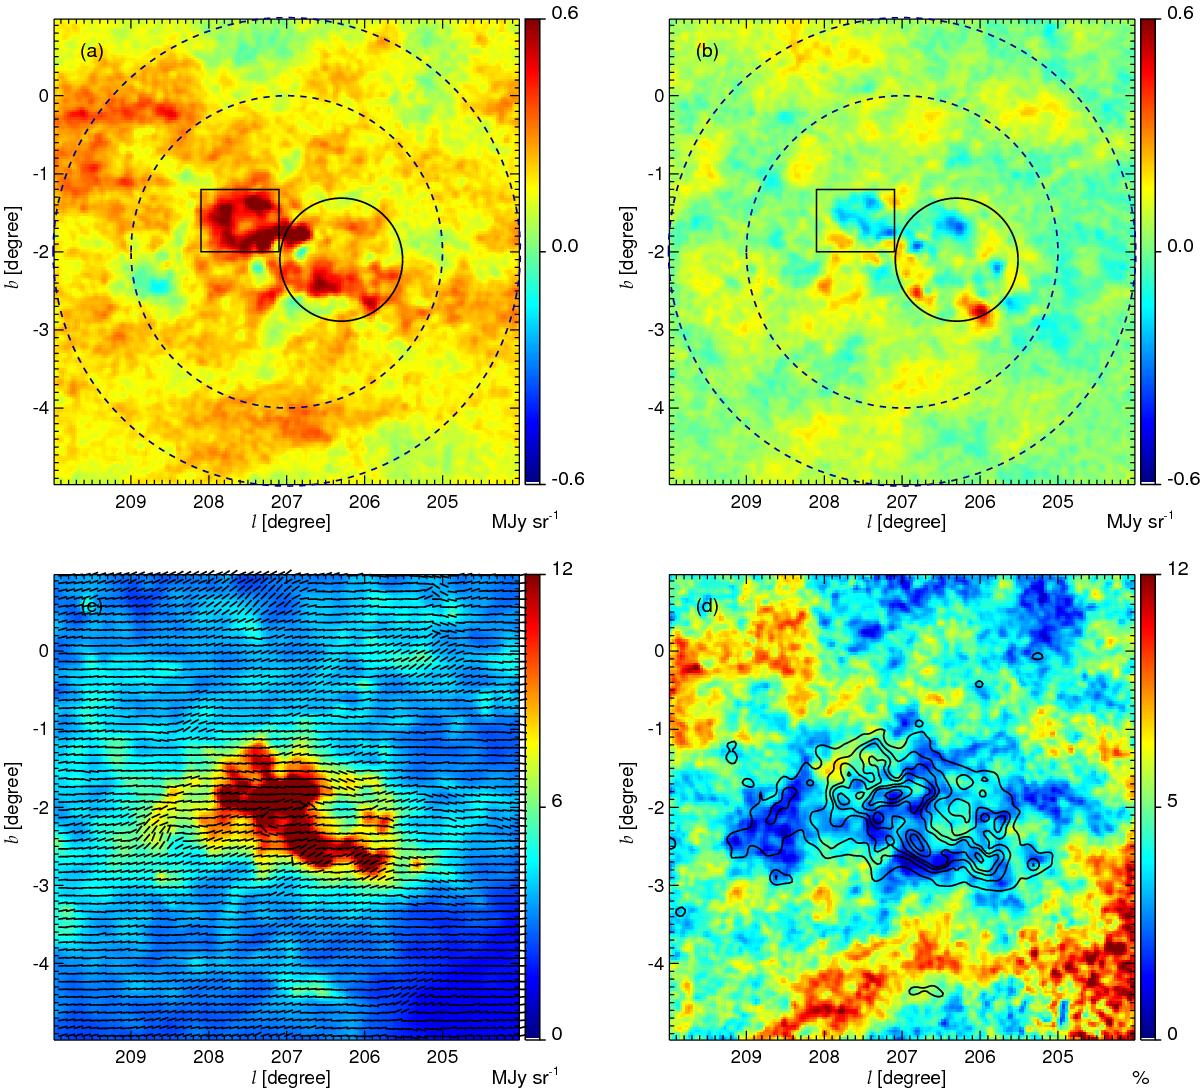
Planck polarization maps of the Rosette region: a) Q Stokes parameter; b) U Stokes parameter. The dashed circles, with radii 2° and 3°, define the region where we estimate the background level, the full circle centred on the star cluster represents the outer radius of the dust shell, ![]() pc, and the rectangle encompasses the brightest part of the Mon OB2 cloud. c) Intensity map at 353 GHz with the plane-of-the-sky magnetic field orientation shown by headless vectors, obtained by rotating the polarization angle ψ by 90°. The vectors are plotted at every 6′, from the average of Q and U within the same distance from the central pixel. d) Polarization fraction p, with the same intensity contours as in Fig. 2.
pc, and the rectangle encompasses the brightest part of the Mon OB2 cloud. c) Intensity map at 353 GHz with the plane-of-the-sky magnetic field orientation shown by headless vectors, obtained by rotating the polarization angle ψ by 90°. The vectors are plotted at every 6′, from the average of Q and U within the same distance from the central pixel. d) Polarization fraction p, with the same intensity contours as in Fig. 2.
Current usage metrics show cumulative count of Article Views (full-text article views including HTML views, PDF and ePub downloads, according to the available data) and Abstracts Views on Vision4Press platform.
Data correspond to usage on the plateform after 2015. The current usage metrics is available 48-96 hours after online publication and is updated daily on week days.
Initial download of the metrics may take a while.